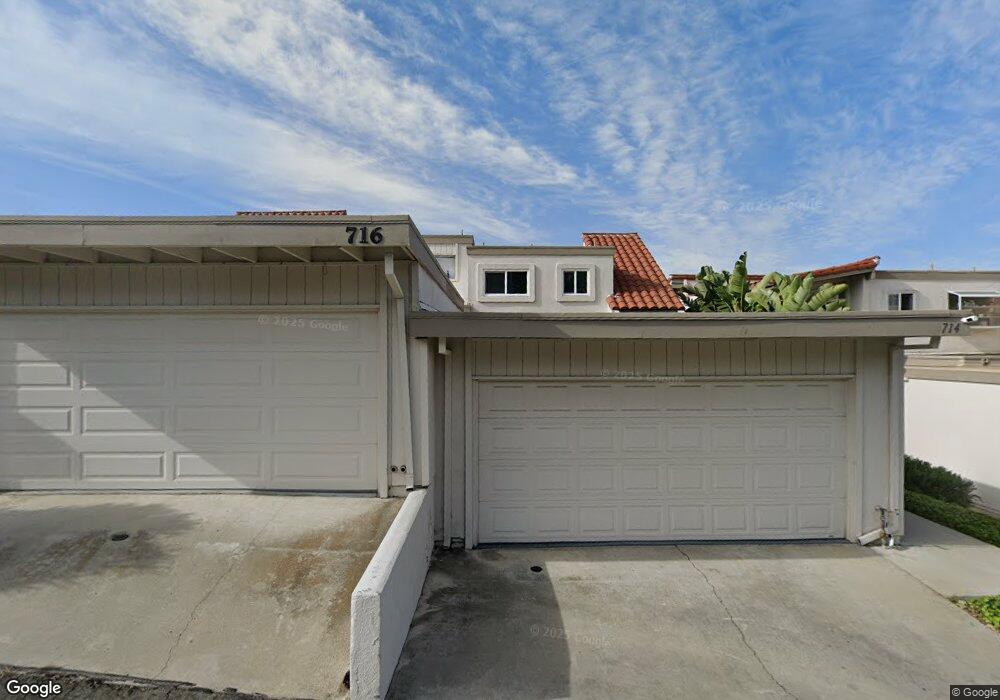
716 Calle Lima San Clemente, CA 92673
Estimated Value: $1,106,156 - $1,403,000
3
Beds
3
Baths
1,242
Sq Ft
$992/Sq Ft
Est. Value
About This Home
This home is located at 716 Calle Lima, San Clemente, CA 92673 and is currently estimated at $1,232,289, approximately $992 per square foot. 716 Calle Lima is a home located in Orange County with nearby schools including Palisades Elementary School, Shorecliffs Middle School, and San Juan Hills High School.
Ownership History
Date
Name
Owned For
Owner Type
Purchase Details
Closed on
Oct 9, 2003
Sold by
Smith Kelly D
Bought by
Binaghi Ana Maria
Current Estimated Value
Home Financials for this Owner
Home Financials are based on the most recent Mortgage that was taken out on this home.
Original Mortgage
$345,000
Outstanding Balance
$144,728
Interest Rate
4.75%
Mortgage Type
Purchase Money Mortgage
Estimated Equity
$1,087,561
Purchase Details
Closed on
Sep 14, 2000
Sold by
Oleary Kelly D
Bought by
Smith Kelly D
Home Financials for this Owner
Home Financials are based on the most recent Mortgage that was taken out on this home.
Original Mortgage
$60,000
Interest Rate
8.07%
Mortgage Type
Stand Alone Second
Purchase Details
Closed on
Jan 27, 1999
Sold by
Oleary Brian D and Kelly Smith Kelly
Bought by
Oleary Kelly D
Home Financials for this Owner
Home Financials are based on the most recent Mortgage that was taken out on this home.
Original Mortgage
$149,000
Interest Rate
6.63%
Create a Home Valuation Report for This Property
The Home Valuation Report is an in-depth analysis detailing your home's value as well as a comparison with similar homes in the area
Home Values in the Area
Average Home Value in this Area
Purchase History
| Date | Buyer | Sale Price | Title Company |
|---|---|---|---|
| Binaghi Ana Maria | $460,000 | Chicago Title Co | |
| Smith Kelly D | -- | Southland Title Corporation | |
| Oleary Kelly D | -- | -- |
Source: Public Records
Mortgage History
| Date | Status | Borrower | Loan Amount |
|---|---|---|---|
| Open | Binaghi Ana Maria | $345,000 | |
| Previous Owner | Smith Kelly D | $60,000 | |
| Previous Owner | Oleary Kelly D | $149,000 |
Source: Public Records
Tax History Compared to Growth
Tax History
| Year | Tax Paid | Tax Assessment Tax Assessment Total Assessment is a certain percentage of the fair market value that is determined by local assessors to be the total taxable value of land and additions on the property. | Land | Improvement |
|---|---|---|---|---|
| 2025 | $6,014 | $611,362 | $513,987 | $97,375 |
| 2024 | $6,014 | $599,375 | $503,909 | $95,466 |
| 2023 | $5,885 | $587,623 | $494,028 | $93,595 |
| 2022 | $5,772 | $576,101 | $484,341 | $91,760 |
| 2021 | $5,659 | $564,805 | $474,844 | $89,961 |
| 2020 | $5,602 | $559,014 | $469,975 | $89,039 |
| 2019 | $5,491 | $548,053 | $460,759 | $87,294 |
| 2018 | $5,384 | $537,307 | $451,724 | $85,583 |
| 2017 | $5,278 | $526,772 | $442,867 | $83,905 |
| 2016 | $5,175 | $516,444 | $434,184 | $82,260 |
| 2015 | $5,096 | $508,687 | $427,662 | $81,025 |
| 2014 | $4,829 | $482,135 | $406,514 | $75,621 |
Source: Public Records
Map
Nearby Homes
- 3813 Via Manzana
- 715 Calle Camisa
- 3807 Via Manzana
- 3703 Calle la Quinta
- 27062 Calle Juanita
- 34555 Camino el Molino
- 3 Via Pasa
- 3 Calle Agua
- 34605 Calle Portola
- 34561 Calle Portola
- 19 Marbella
- 4103 Calle Bienvenido
- 27002 Avenida Las Palmas
- 33801 Glocamora Ln
- 472 Plaza Estival
- 3481 Paseo Flamenco
- 28101 Pacifica Del Mar
- 14 Tesoro
- 4 Via Del Tesoro
- 34671 Calle Rosita
- 718 Calle Lima
- 714 Calle Lima
- 720 Calle Lima
- 712 Calle Lima
- 710 Calle Lima
- 3813 Calle la Quinta
- 714 Calle Cetro
- 883 Calle Pluma
- 716 Calle Cetro
- 885 Calle Pluma
- 712 Calle Cetro
- 3811 Calle la Quinta
- 718 Calle Cetro
- 879 Calle Pluma Unit 200
- 879 Calle Pluma
- 3814 Calle la Quinta
- 877 Calle Pluma
- 3809 Calle la Quinta
- 3812 Calle la Quinta
- 875 Calle Pluma