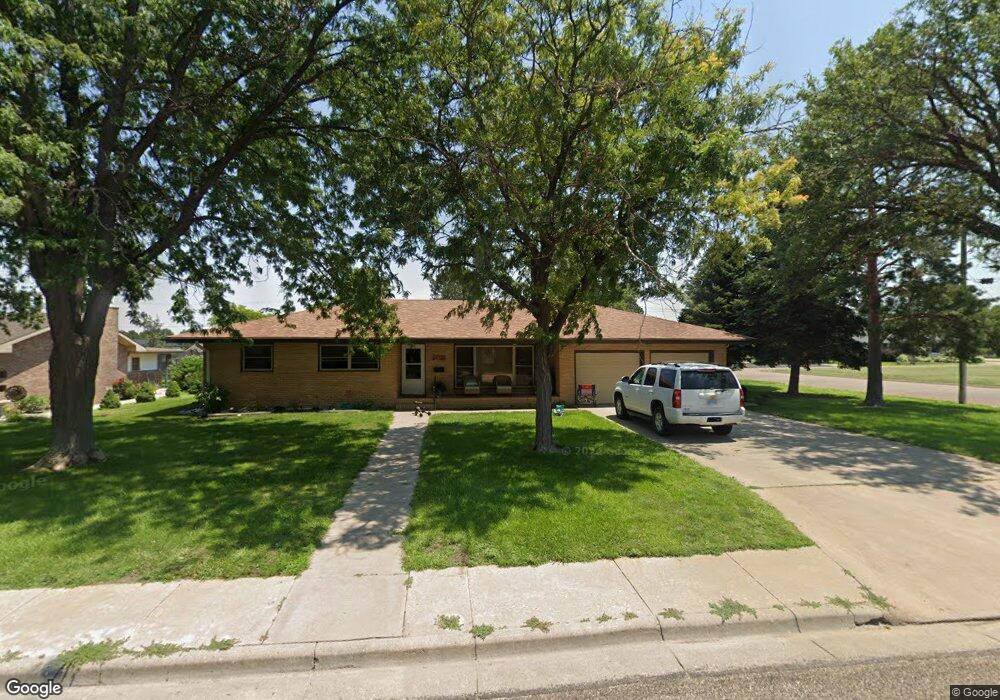
716 E 5th St Goodland, KS 67735
Estimated Value: $230,000 - $344,753
3
Beds
3
Baths
1,933
Sq Ft
$160/Sq Ft
Est. Value
About This Home
This home is located at 716 E 5th St, Goodland, KS 67735 and is currently estimated at $309,938, approximately $160 per square foot. 716 E 5th St is a home located in Sherman County with nearby schools including West Elementary School, North Elementary School, and Goodland Junior/Senior High School.
Create a Home Valuation Report for This Property
The Home Valuation Report is an in-depth analysis detailing your home's value as well as a comparison with similar homes in the area
Home Values in the Area
Average Home Value in this Area
Purchase History
| Date | Buyer | Sale Price | Title Company |
|---|---|---|---|
| G S Bancshares Inc | -- | -- |
Source: Public Records
Tax History
| Year | Tax Paid | Tax Assessment Tax Assessment Total Assessment is a certain percentage of the fair market value that is determined by local assessors to be the total taxable value of land and additions on the property. | Land | Improvement |
|---|---|---|---|---|
| 2025 | $6,135 | $34,611 | $1,590 | $33,021 |
| 2024 | $61 | $33,603 | $1,590 | $32,013 |
| 2023 | $5,990 | $33,603 | $1,590 | $32,013 |
| 2022 | $4,339 | $31,585 | $1,581 | $30,004 |
| 2021 | $4,339 | $29,796 | $1,581 | $28,215 |
| 2020 | $4,339 | $24,839 | $1,581 | $23,258 |
| 2019 | $4,017 | $24,115 | $1,573 | $22,542 |
| 2018 | $4,015 | $24,115 | $1,573 | $22,542 |
| 2017 | $3,922 | $24,115 | $1,573 | $22,542 |
| 2016 | $4,105 | $24,135 | $1,573 | $22,562 |
| 2015 | -- | $23,207 | $1,573 | $21,634 |
| 2014 | -- | $22,066 | $1,478 | $20,588 |
Source: Public Records
Map
Nearby Homes
- 402 College Ave
- 300 Harrison Ave
- 710 College Ave
- 328 Eustis Ave
- 308 Clark St
- 907 Walnut St
- 820 Washington Ave
- 311 E 9th St
- 1015 Walnut Ave
- 624 E 11th St
- 1015 Harrison Ave
- 314 Main Ave
- 202 Main Ave
- 704 Center St
- 223 N Main Ave
- 1207 Caldwell Ave
- 307 N Main Ave
- 1301 College Ave
- 411 W 4th St
- 1402 Harrison Ave
Your Personal Tour Guide
Ask me questions while you tour the home.