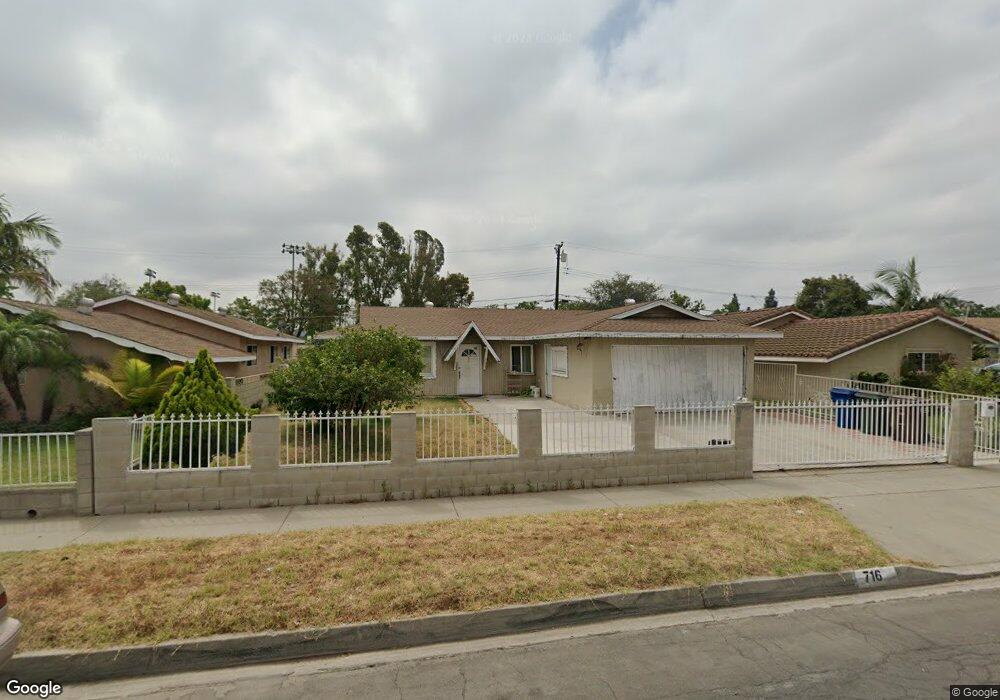
716 Evanwood Ave La Puente, CA 91744
West Puente Valley NeighborhoodEstimated Value: $726,688 - $761,000
3
Beds
2
Baths
1,196
Sq Ft
$623/Sq Ft
Est. Value
About This Home
This home is located at 716 Evanwood Ave, La Puente, CA 91744 and is currently estimated at $745,422, approximately $623 per square foot. 716 Evanwood Ave is a home located in Los Angeles County with nearby schools including Sparks Middle School, La Puente High School, and Hillside Baptist Academy.
Ownership History
Date
Name
Owned For
Owner Type
Purchase Details
Closed on
Apr 22, 2020
Sold by
Mai Bo Ru and Wu Huanhong
Bought by
Mai Bo Ru and Wu Huanhong
Current Estimated Value
Home Financials for this Owner
Home Financials are based on the most recent Mortgage that was taken out on this home.
Original Mortgage
$336,500
Outstanding Balance
$299,214
Interest Rate
3.6%
Mortgage Type
New Conventional
Estimated Equity
$446,208
Purchase Details
Closed on
Jan 18, 2020
Sold by
Mai Bo Ru and Mai Yong Yu
Bought by
Mai Bo Ru and Wu Huanhong
Purchase Details
Closed on
Nov 30, 2010
Sold by
Ramirez Magdalena
Bought by
Mai Bo Ru and Mai Yong Yu
Home Financials for this Owner
Home Financials are based on the most recent Mortgage that was taken out on this home.
Original Mortgage
$220,000
Interest Rate
4.18%
Mortgage Type
New Conventional
Purchase Details
Closed on
Nov 24, 1998
Sold by
Ayala Javier V
Bought by
Ramirez Magadalena
Home Financials for this Owner
Home Financials are based on the most recent Mortgage that was taken out on this home.
Original Mortgage
$87,400
Interest Rate
6.69%
Create a Home Valuation Report for This Property
The Home Valuation Report is an in-depth analysis detailing your home's value as well as a comparison with similar homes in the area
Home Values in the Area
Average Home Value in this Area
Purchase History
| Date | Buyer | Sale Price | Title Company |
|---|---|---|---|
| Mai Bo Ru | -- | Wfg National Title | |
| Mai Bo Ru | -- | None Available | |
| Mai Bo Ru | $275,000 | Stewart Title Riverside | |
| Ramirez Magadalena | -- | Southland Title Corporation |
Source: Public Records
Mortgage History
| Date | Status | Borrower | Loan Amount |
|---|---|---|---|
| Open | Mai Bo Ru | $336,500 | |
| Closed | Mai Bo Ru | $220,000 | |
| Previous Owner | Ramirez Magadalena | $87,400 |
Source: Public Records
Tax History Compared to Growth
Tax History
| Year | Tax Paid | Tax Assessment Tax Assessment Total Assessment is a certain percentage of the fair market value that is determined by local assessors to be the total taxable value of land and additions on the property. | Land | Improvement |
|---|---|---|---|---|
| 2025 | $4,479 | $352,310 | $229,708 | $122,602 |
| 2024 | $4,479 | $345,403 | $225,204 | $120,199 |
| 2023 | $4,366 | $338,632 | $220,789 | $117,843 |
| 2022 | $4,239 | $331,993 | $216,460 | $115,533 |
| 2021 | $4,161 | $325,484 | $212,216 | $113,268 |
| 2019 | $4,042 | $315,831 | $205,922 | $109,909 |
| 2018 | $3,882 | $309,639 | $201,885 | $107,754 |
| 2016 | $3,597 | $297,618 | $194,047 | $103,571 |
| 2015 | $3,529 | $293,149 | $191,133 | $102,016 |
| 2014 | $3,473 | $287,407 | $187,389 | $100,018 |
Source: Public Records
Map
Nearby Homes
- 750 Glenshaw Dr
- 822 Greenberry Dr
- 14612 Hutchcroft St
- 829 Foxworth Ave
- 14972 Giordano St
- 932 Shadydale Ave
- 14940 Beckner St
- 736 Tonopah Ave
- 14510 Amar Rd Unit J
- 14421 Flynn St
- 357 Cadbrook Dr
- 544 N Orange Ave Unit B
- 15246 Temple Ave
- 1260 Greenberry Dr
- 15416 Giordano St
- 1828 Stargaze Dr
- 1528 W Delvale St
- 1329 N Stimson Ave
- 610 Willow Ave
- 1358 N Stimson Ave
- 722 Evanwood Ave
- 710 Evanwood Ave
- 704 Evanwood Ave
- 728 Evanwood Ave
- 14740 Ector St
- 666 Evanwood Ave
- 709 Evanwood Ave
- 736 Evanwood Ave
- 729 Evanwood Ave
- 703 Evanwood Ave
- 14734 Ector St
- 660 Evanwood Ave
- 735 Evanwood Ave
- 741 Evanwood Ave
- 14735 Hutchcroft St
- 718 Broadmoor Ave
- 654 Evanwood Ave
- 14728 Ector St
- 14740 Hutchcroft St
- 722 Broadmoor Ave