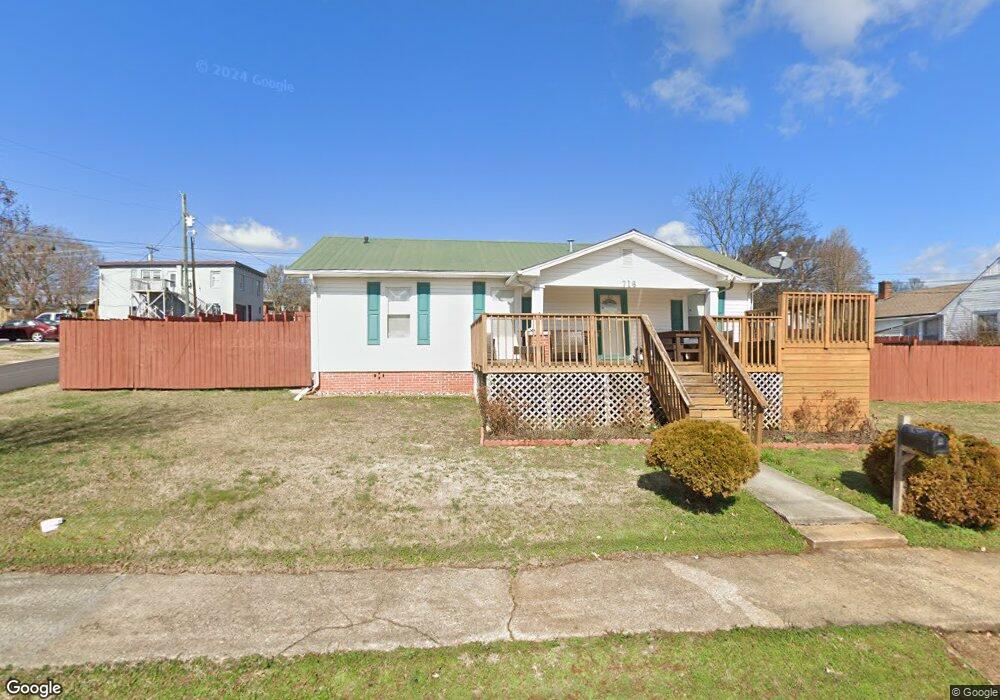
716 Ferry St Loudon, TN 37774
Estimated Value: $173,000 - $224,000
Studio
2
Baths
1,240
Sq Ft
$153/Sq Ft
Est. Value
About This Home
This home is located at 716 Ferry St, Loudon, TN 37774 and is currently estimated at $189,311, approximately $152 per square foot. 716 Ferry St is a home located in Loudon County with nearby schools including Loudon High School.
Ownership History
Date
Name
Owned For
Owner Type
Purchase Details
Closed on
Jun 30, 2016
Sold by
Gonzalez Manuel A
Bought by
Gonzalez Manuel A
Current Estimated Value
Home Financials for this Owner
Home Financials are based on the most recent Mortgage that was taken out on this home.
Original Mortgage
$83,600
Outstanding Balance
$36,698
Interest Rate
2.78%
Estimated Equity
$152,613
Purchase Details
Closed on
Sep 21, 2007
Sold by
Blake Bivens
Bought by
Gonzalez Manuel A
Purchase Details
Closed on
Aug 29, 2003
Bought by
Bivens Blake
Purchase Details
Closed on
Sep 5, 1998
Bought by
Williams Joseph W and Williams Barbara F
Purchase Details
Closed on
Aug 8, 1986
Bought by
Chihasz Sara J %Collateral Invest Co
Create a Home Valuation Report for This Property
The Home Valuation Report is an in-depth analysis detailing your home's value as well as a comparison with similar homes in the area
Home Values in the Area
Average Home Value in this Area
Purchase History
| Date | Buyer | Sale Price | Title Company |
|---|---|---|---|
| Gonzalez Manuel A | -- | -- | |
| Gonzalez Manuel A | $84,000 | -- | |
| Bivens Blake | $74,000 | -- | |
| Williams Joseph W | $35,000 | -- | |
| Chihasz Sara J %Collateral Invest Co | $25,000 | -- |
Source: Public Records
Mortgage History
| Date | Status | Borrower | Loan Amount |
|---|---|---|---|
| Open | Gonzalez Manuel A | $83,600 |
Source: Public Records
Tax History
| Year | Tax Paid | Tax Assessment Tax Assessment Total Assessment is a certain percentage of the fair market value that is determined by local assessors to be the total taxable value of land and additions on the property. | Land | Improvement |
|---|---|---|---|---|
| 2025 | $481 | $27,200 | $5,175 | $22,025 |
| 2024 | $712 | $27,200 | $5,175 | $22,025 |
| 2023 | $712 | $27,200 | $0 | $0 |
| 2022 | $712 | $27,200 | $5,175 | $22,025 |
| 2021 | $712 | $27,200 | $5,175 | $22,025 |
| 2020 | $558 | $27,200 | $5,175 | $22,025 |
| 2019 | $558 | $18,375 | $4,675 | $13,700 |
| 2018 | $547 | $18,375 | $4,675 | $13,700 |
| 2017 | $547 | $18,375 | $4,675 | $13,700 |
| 2016 | $607 | $20,000 | $5,750 | $14,250 |
| 2015 | $607 | $20,000 | $5,750 | $14,250 |
| 2014 | $607 | $20,000 | $5,750 | $14,250 |
Source: Public Records
Map
Nearby Homes
Your Personal Tour Guide
Ask me questions while you tour the home.