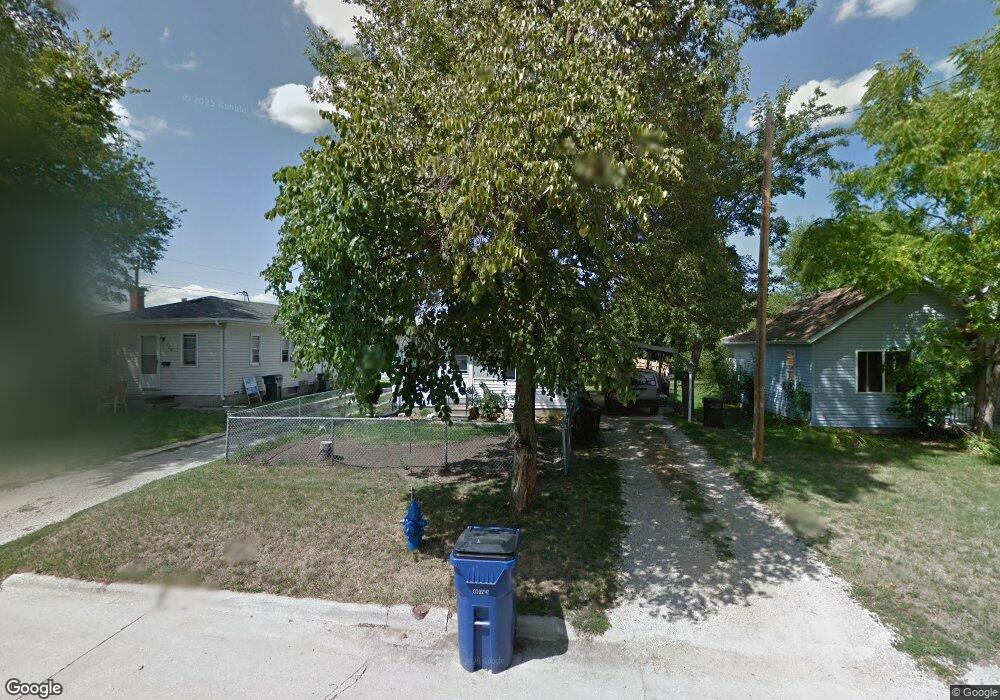
716 Hartman Ave Waterloo, IA 50701
Edison NeighborhoodEstimated Value: $114,711 - $126,000
2
Beds
1
Bath
836
Sq Ft
$146/Sq Ft
Est. Value
About This Home
This home is located at 716 Hartman Ave, Waterloo, IA 50701 and is currently estimated at $122,428, approximately $146 per square foot. 716 Hartman Ave is a home located in Black Hawk County with nearby schools including Becker Elementary School, Central Middle School, and East High School.
Ownership History
Date
Name
Owned For
Owner Type
Purchase Details
Closed on
May 16, 2014
Sold by
Hedrick Jordan and Hedrick Samantha
Bought by
Reichenbacker Cory M
Current Estimated Value
Home Financials for this Owner
Home Financials are based on the most recent Mortgage that was taken out on this home.
Original Mortgage
$15,200
Interest Rate
4.28%
Mortgage Type
Closed End Mortgage
Purchase Details
Closed on
Apr 16, 2010
Sold by
Henson Gregg and Henson Tamera A
Bought by
Hedrick Jordan and Hoppman Samantha
Home Financials for this Owner
Home Financials are based on the most recent Mortgage that was taken out on this home.
Original Mortgage
$72,659
Interest Rate
5.02%
Mortgage Type
FHA
Purchase Details
Closed on
Nov 22, 2005
Sold by
Hunt Jerry N and Hunt Robin L
Bought by
Morelock Tamera A
Home Financials for this Owner
Home Financials are based on the most recent Mortgage that was taken out on this home.
Original Mortgage
$62,900
Interest Rate
7%
Mortgage Type
Adjustable Rate Mortgage/ARM
Create a Home Valuation Report for This Property
The Home Valuation Report is an in-depth analysis detailing your home's value as well as a comparison with similar homes in the area
Home Values in the Area
Average Home Value in this Area
Purchase History
| Date | Buyer | Sale Price | Title Company |
|---|---|---|---|
| Reichenbacker Cory M | $76,000 | None Available | |
| Hedrick Jordan | $74,000 | Black Hawk County Abstract | |
| Morelock Tamera A | $70,000 | None Available |
Source: Public Records
Mortgage History
| Date | Status | Borrower | Loan Amount |
|---|---|---|---|
| Closed | Reichenbacker Cory M | $15,200 | |
| Open | Reichenbacker Cory M | $60,800 | |
| Previous Owner | Hedrick Jordan | $72,659 | |
| Previous Owner | Morelock Tamera A | $62,900 |
Source: Public Records
Tax History Compared to Growth
Tax History
| Year | Tax Paid | Tax Assessment Tax Assessment Total Assessment is a certain percentage of the fair market value that is determined by local assessors to be the total taxable value of land and additions on the property. | Land | Improvement |
|---|---|---|---|---|
| 2024 | $1,864 | $96,180 | $12,610 | $83,570 |
| 2023 | $1,472 | $96,180 | $12,610 | $83,570 |
| 2022 | $1,432 | $75,940 | $12,610 | $63,330 |
| 2021 | $1,416 | $75,940 | $12,610 | $63,330 |
| 2020 | $1,388 | $71,090 | $7,760 | $63,330 |
| 2019 | $1,388 | $71,090 | $7,760 | $63,330 |
| 2018 | $1,390 | $71,090 | $7,760 | $63,330 |
| 2017 | $1,436 | $71,090 | $7,760 | $63,330 |
| 2016 | $1,416 | $71,090 | $7,760 | $63,330 |
| 2015 | $1,416 | $71,090 | $7,760 | $63,330 |
| 2014 | $1,442 | $71,090 | $7,760 | $63,330 |
Source: Public Records
Map
Nearby Homes
- 725 Harwood Ave
- 1018 Janney Ave
- 128 Axlewood Dr
- 124 Axlewood Dr
- 131 Axlewood Dr
- 118 Axlewood Dr
- 125 Axlewood Dr
- 119 Axlewood Dr
- 117 Axlewood Dr
- 2320 University Ave
- 323 Hartman Ave
- 1311 Magnolia Pkwy
- 1308 Wallgate Ave
- 631 Wallgate Ave
- 610 Wallgate Ave
- 608 Wallgate Ave
- 525 Evergreen Ave
- 640 Maxwell St
- 1221 Downing Ave
- 1225 Downing Ave
- 714 Hartman Ave
- 720 Hartman Ave
- 708 Hartman Ave
- 724 Hartman Ave
- Falls Plaza Falls Ave
- 704 Hartman Ave
- 2315 Falls Ave Unit 1
- 2315 Falls Ave Unit 5
- 802 Hartman Ave
- 2327 Falls Ave Unit 8
- 2327 Falls Ave Unit 4
- 2327 Falls Ave Unit 3
- 2327 Falls Ave Unit Suite 3
- 2327 Falls Ave Unit Suite 4
- 2327 Falls Ave Unit 7
- 2327 Falls Ave Unit 6
- 2327 Falls Ave Unit 5
- 2327 Falls Ave Unit 2
- 2327 Falls Ave Unit 1
- 2307 Falls Ave Unit Suite 5