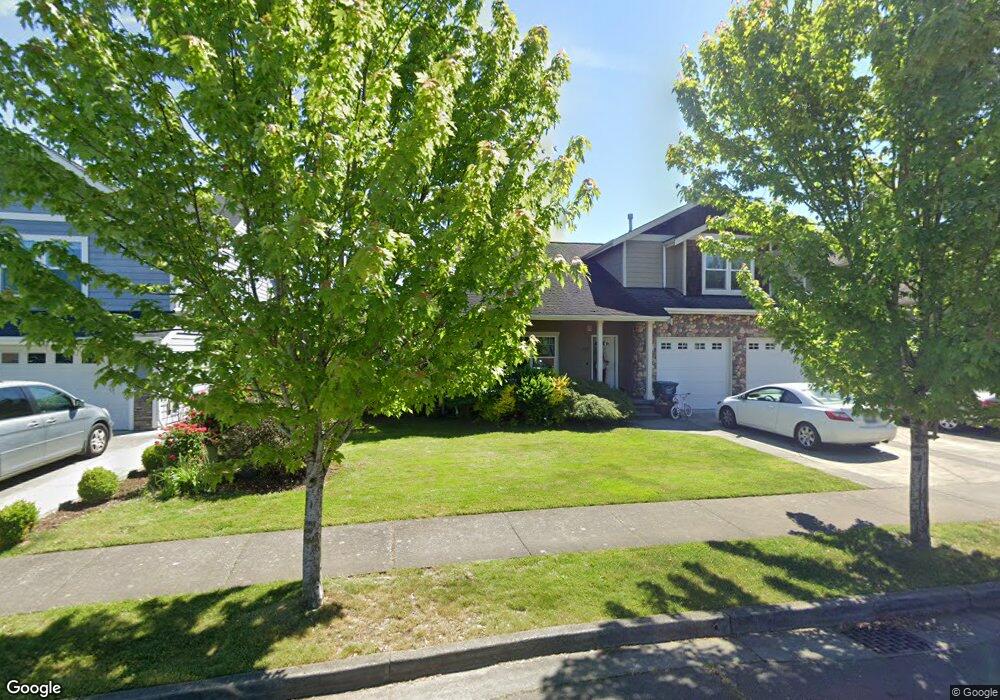
716 Mapleridge Dr Everson, WA 98247
Estimated Value: $600,000 - $652,000
4
Beds
4
Baths
2,344
Sq Ft
$269/Sq Ft
Est. Value
About This Home
This home is located at 716 Mapleridge Dr, Everson, WA 98247 and is currently estimated at $629,639, approximately $268 per square foot. 716 Mapleridge Dr is a home located in Whatcom County with nearby schools including Everson Elementary School, Nooksack Elementary School, and Sumas Elementary School.
Ownership History
Date
Name
Owned For
Owner Type
Purchase Details
Closed on
May 27, 2009
Sold by
Geyer William T and Geyer Ruth M
Bought by
Mcconnell Joshua Vansteenwhyk
Current Estimated Value
Home Financials for this Owner
Home Financials are based on the most recent Mortgage that was taken out on this home.
Original Mortgage
$212,000
Outstanding Balance
$131,845
Interest Rate
4.8%
Mortgage Type
Purchase Money Mortgage
Estimated Equity
$497,794
Purchase Details
Closed on
Nov 12, 2008
Sold by
Tembe Llc
Bought by
Geyer William T and Geyer Ruth M
Home Financials for this Owner
Home Financials are based on the most recent Mortgage that was taken out on this home.
Original Mortgage
$75,000
Interest Rate
6.07%
Mortgage Type
Unknown
Purchase Details
Closed on
Aug 26, 2005
Sold by
Maple Ridge Declarent Llc
Bought by
Tembe Llc
Create a Home Valuation Report for This Property
The Home Valuation Report is an in-depth analysis detailing your home's value as well as a comparison with similar homes in the area
Home Values in the Area
Average Home Value in this Area
Purchase History
| Date | Buyer | Sale Price | Title Company |
|---|---|---|---|
| Mcconnell Joshua Vansteenwhyk | $208,180 | Chicago Title Insurance | |
| Geyer William T | -- | Stewart Title Company | |
| Tembe Llc | $82,780 | Chicago Title Insurance |
Source: Public Records
Mortgage History
| Date | Status | Borrower | Loan Amount |
|---|---|---|---|
| Open | Mcconnell Joshua Vansteenwhyk | $212,000 | |
| Previous Owner | Geyer William T | $75,000 | |
| Previous Owner | Geyer William T | $175,000 |
Source: Public Records
Tax History
| Year | Tax Paid | Tax Assessment Tax Assessment Total Assessment is a certain percentage of the fair market value that is determined by local assessors to be the total taxable value of land and additions on the property. | Land | Improvement |
|---|---|---|---|---|
| 2025 | $4,725 | $528,496 | $188,100 | $340,396 |
| 2024 | $5,238 | $512,094 | $180,000 | $332,094 |
| 2023 | $5,238 | $583,649 | $154,962 | $428,687 |
| 2022 | $4,791 | $525,820 | $139,608 | $386,212 |
| 2021 | $4,427 | $434,567 | $115,380 | $319,187 |
| 2020 | $4,250 | $353,315 | $93,807 | $259,508 |
| 2019 | $3,599 | $353,315 | $93,807 | $259,508 |
| 2018 | $4,278 | $338,976 | $90,000 | $248,976 |
| 2017 | $3,826 | $300,484 | $81,200 | $219,284 |
| 2016 | $3,655 | $277,287 | $74,900 | $202,387 |
| 2015 | $3,095 | $265,991 | $72,240 | $193,751 |
| 2014 | -- | $257,743 | $70,000 | $187,743 |
| 2013 | -- | $257,743 | $70,000 | $187,743 |
Source: Public Records
Map
Nearby Homes
- 715 Red Maple Loop
- 616 Strandell St
- 1005 Night Hawk Way
- 1203 Red Tail Ct
- 800 Cedar Dr
- 809 Pine Crest Dr
- 1302 Night Hawk Way
- 0 Walnut Grove Ct
- 107 River St
- 408 W 3rd St
- 416 W 3rd St
- 108 Baker St Unit 1-4
- 207 E Main St
- 208 W 4th St
- 212 W 4th St
- 110 Baker St Unit A & B
- 2495 River Rock Dr
- 107 Thendara Park Dr Unit C
- 3037 Massey Rd
- 1822 E Pole Rd
- 720 Mapleridge Dr
- 712 Mapleridge Dr
- 708 Mapleridge Dr
- 802 Mapleridge Dr
- 1 Ridge Ln
- 1007 Ridge Ln
- 721 Mapleridge Dr
- 1002 Ridge Ln
- 0 Maple Ridge Dr Unit 2008599
- 803 Mapleridge Dr
- 1006 Ridge Ln
- 1011 Ridge Ln
- 0 Ridge Ln Unit 731703
- 0 Ridge Ln Unit 28116303
- 807 Mapleridge Dr
- 1010 Ridge Ln
- 804 Red Maple Loop
- 820 Red Maple Loop
Your Personal Tour Guide
Ask me questions while you tour the home.