716 Mapleview Dr Shelbyville, TN 37160
Estimated Value: $282,081 - $425,000
--
Bed
2
Baths
1,430
Sq Ft
$235/Sq Ft
Est. Value
About This Home
This home is located at 716 Mapleview Dr, Shelbyville, TN 37160 and is currently estimated at $335,520, approximately $234 per square foot. 716 Mapleview Dr is a home located in Bedford County with nearby schools including Cascade Elementary School, Cascade Middle School, and Cascade High School.
Ownership History
Date
Name
Owned For
Owner Type
Purchase Details
Closed on
Feb 10, 1995
Sold by
Smith Barry D
Bought by
Smith Kathy S
Current Estimated Value
Purchase Details
Closed on
Jun 22, 1993
Bought by
Smith Barry D
Purchase Details
Closed on
Mar 3, 1993
Bought by
Sec Of Housing Suite 200
Purchase Details
Closed on
Aug 19, 1988
Bought by
Huitt Jeffrey Lee and Huitt Brenda G
Purchase Details
Closed on
Jan 21, 1987
Bought by
Parker Marvin B
Create a Home Valuation Report for This Property
The Home Valuation Report is an in-depth analysis detailing your home's value as well as a comparison with similar homes in the area
Home Values in the Area
Average Home Value in this Area
Purchase History
| Date | Buyer | Sale Price | Title Company |
|---|---|---|---|
| Smith Kathy S | -- | -- | |
| Smith Barry D | $67,600 | -- | |
| Sec Of Housing Suite 200 | -- | -- | |
| Huitt Jeffrey Lee | $64,200 | -- | |
| Parker Marvin B | $6,000 | -- |
Source: Public Records
Tax History Compared to Growth
Tax History
| Year | Tax Paid | Tax Assessment Tax Assessment Total Assessment is a certain percentage of the fair market value that is determined by local assessors to be the total taxable value of land and additions on the property. | Land | Improvement |
|---|---|---|---|---|
| 2025 | $1,122 | $48,250 | $0 | $0 |
| 2024 | $1,122 | $48,250 | $8,000 | $40,250 |
| 2023 | $1,122 | $48,250 | $8,000 | $40,250 |
| 2022 | $1,050 | $45,175 | $8,000 | $37,175 |
| 2021 | $849 | $45,175 | $8,000 | $37,175 |
| 2020 | $718 | $43,225 | $8,000 | $35,225 |
| 2019 | $718 | $26,975 | $5,625 | $21,350 |
| 2018 | $691 | $26,975 | $5,625 | $21,350 |
| 2017 | $691 | $26,975 | $5,625 | $21,350 |
| 2016 | $680 | $26,975 | $5,625 | $21,350 |
| 2015 | $680 | $26,975 | $5,625 | $21,350 |
| 2014 | $564 | $24,866 | $0 | $0 |
Source: Public Records
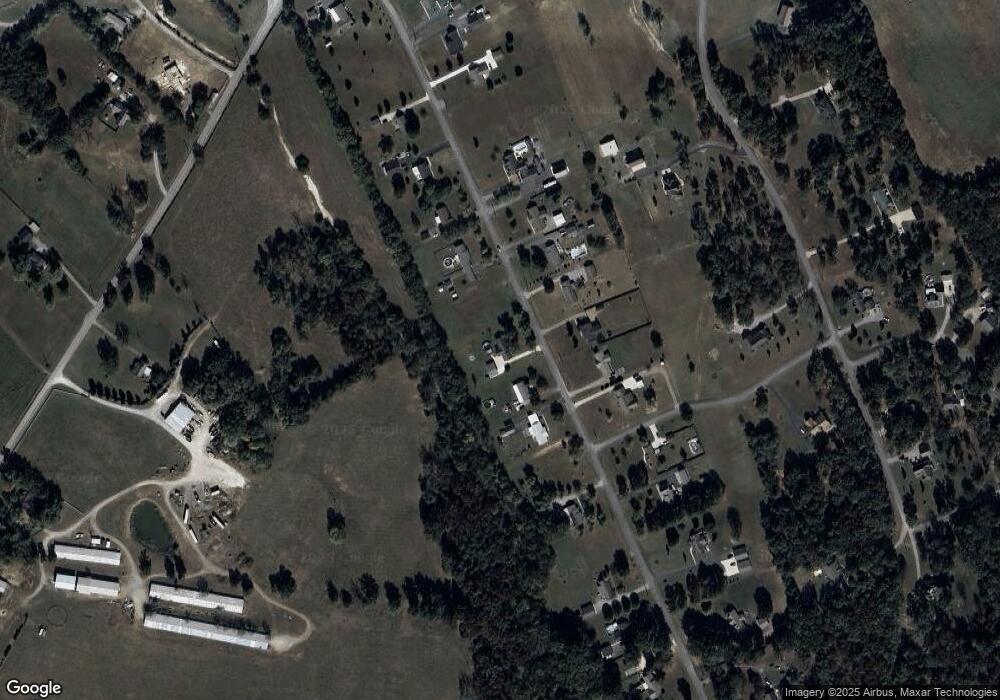
Map
Nearby Homes
- 0 Horse Mountain Rd Unit 1010628
- 0 Horse Mountain Rd Unit RTC2821435
- 321 Winners Cir
- 294 McDale Rd
- 105 Winners Cir
- 409 Winners Cir
- 104 Hillview Ave
- 201 Hillview Ave
- 222 Hillview Ave
- 117 Raven Ct
- 102 Hidden
- 103 Meadowbrook
- 112 Hidden
- 114 Hidden
- 116 Hidden
- 118 Hidden
- 0 Richdale Ln
- 104 Indy Ct
- 105 N Point Cir N
- 307 Ledgeview Dr
- 718 Mapleview Dr
- 722 Mapleview Dr
- 712 Mapleview Dr
- 719 Mapleview Dr
- 721 Mapleview Dr
- 717 Mapleview Dr
- 723 Mapleview Dr
- 715 Mapleview Dr
- 710 Mapleview Dr
- 725 Mapleview Dr
- 800 Mapleview Dr
- 711 Mapleview Dr
- 801 Mapleview Dr
- 708 Mapleview Dr
- 805 Mapleview Dr
- 706 Mapleview Dr
- 138 Longwood Dr
- 804 Mapleview Dr
- 144 Longwood Dr
- 803 Mapleview Dr