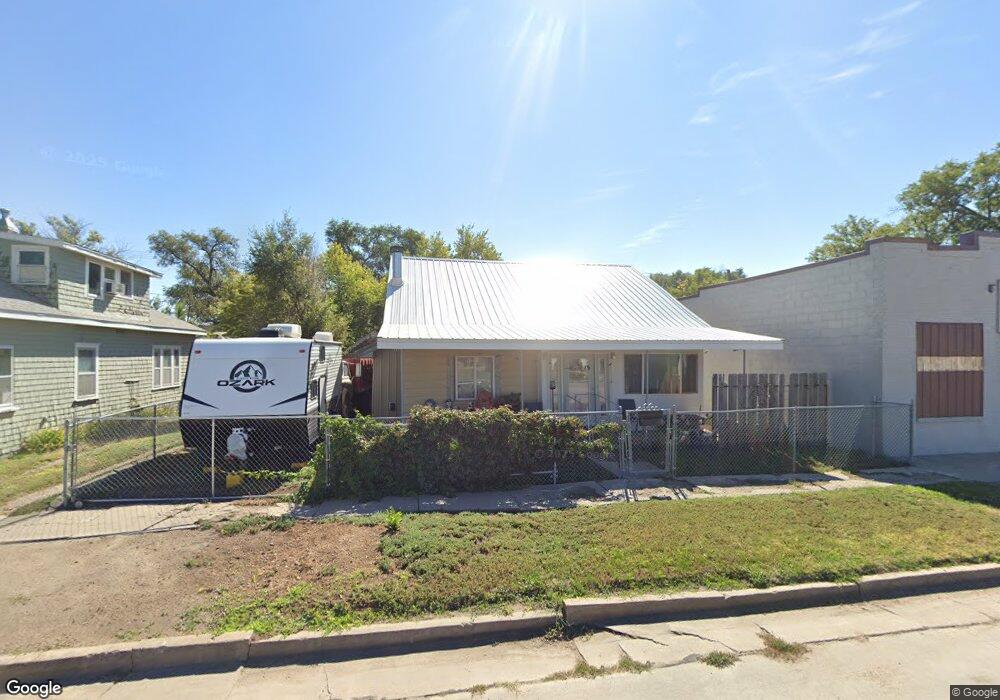
716 N 3rd St Sterling, CO 80751
Estimated Value: $129,000 - $145,000
2
Beds
1
Bath
844
Sq Ft
$160/Sq Ft
Est. Value
About This Home
This home is located at 716 N 3rd St, Sterling, CO 80751 and is currently estimated at $135,061, approximately $160 per square foot. 716 N 3rd St is a home located in Logan County with nearby schools including Campbell Elementary School, Ayres Elementary School, and Sterling Middle School.
Ownership History
Date
Name
Owned For
Owner Type
Purchase Details
Closed on
Aug 4, 2021
Sold by
Haberkom Rebecca and Estate Of Tim L Haberkom
Bought by
Haberkom Steven P
Current Estimated Value
Home Financials for this Owner
Home Financials are based on the most recent Mortgage that was taken out on this home.
Original Mortgage
$7,061
Outstanding Balance
$6,361
Interest Rate
3%
Mortgage Type
Stand Alone Second
Estimated Equity
$128,700
Purchase Details
Closed on
Feb 10, 2009
Sold by
Robinson Dorothy J and Douglas Robinson R
Bought by
Haberkorn Steven P and Haberkorn Tim L
Create a Home Valuation Report for This Property
The Home Valuation Report is an in-depth analysis detailing your home's value as well as a comparison with similar homes in the area
Purchase History
| Date | Buyer | Sale Price | Title Company |
|---|---|---|---|
| Haberkom Steven P | -- | None Available | |
| Haberkorn Steven P | $20,000 | None Available |
Source: Public Records
Mortgage History
| Date | Status | Borrower | Loan Amount |
|---|---|---|---|
| Open | Haberkom Steven P | $7,061 |
Source: Public Records
Tax History
| Year | Tax Paid | Tax Assessment Tax Assessment Total Assessment is a certain percentage of the fair market value that is determined by local assessors to be the total taxable value of land and additions on the property. | Land | Improvement |
|---|---|---|---|---|
| 2025 | $490 | $5,841 | $0 | $0 |
| 2024 | $162 | $5,810 | $0 | $0 |
| 2023 | $162 | $5,810 | $0 | $0 |
| 2022 | $393 | $4,670 | $1,500 | $3,170 |
| 2021 | $384 | $4,800 | $1,540 | $3,260 |
| 2020 | $352 | $8,360 | $1,440 | $6,920 |
| 2019 | $353 | $8,360 | $1,440 | $6,920 |
| 2018 | $285 | $3,360 | $830 | $2,530 |
| 2017 | $280 | $16,310 | $4,030 | $12,280 |
| 2015 | $135 | $13,700 | $3,720 | $9,980 |
| 2014 | $135 | $13,650 | $3,720 | $9,930 |
| 2013 | $135 | $13,650 | $3,720 | $9,930 |
Source: Public Records
Map
Nearby Homes
- 705 N 2nd St
- 777 N 4th St
- 518 N 4th St
- 510 N 4th St
- 510 Pine St
- 501 N 4th St Unit A,B,C,D
- 525 Jackson St
- 414 Mckinley St
- 323 Cleveland St
- 607 Broadway St
- 310 Cleveland St
- 525 Cleveland St
- 107 Stone Ct
- 717-719 Elm St
- 209-213 N 5th St
- 609 N Division Ave Unit A & B
- 502-506 Poplar St
- 1304 N 6th St
- 0 W Main St
- 213 Jefferson St
Your Personal Tour Guide
Ask me questions while you tour the home.