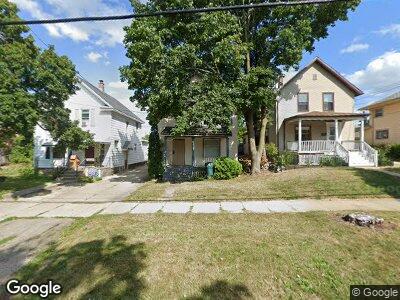
716 N Chestnut St Unit 1 Lansing, MI 48906
Old Forest NeighborhoodEstimated Value: $119,006 - $138,000
--
Bed
--
Bath
1,691
Sq Ft
$78/Sq Ft
Est. Value
About This Home
This home is located at 716 N Chestnut St Unit 1, Lansing, MI 48906 and is currently estimated at $131,502, approximately $77 per square foot. 716 N Chestnut St Unit 1 is a home located in Ingham County with nearby schools including Willow School, Pattengill Academy, and J.W. Sexton High School.
Ownership History
Date
Name
Owned For
Owner Type
Purchase Details
Closed on
Apr 14, 2023
Sold by
Mccants Charles
Bought by
Mccants Charles and Mccants Diann
Current Estimated Value
Purchase Details
Closed on
Jun 23, 2021
Sold by
Alling Bruce and Alling Cathy
Bought by
Mccants Charles
Purchase Details
Closed on
Jun 13, 2002
Sold by
Kim Pier Thomas and Kim Maylee
Bought by
Alling Bruce and Alling Cathy
Home Financials for this Owner
Home Financials are based on the most recent Mortgage that was taken out on this home.
Original Mortgage
$59,800
Interest Rate
6.02%
Purchase Details
Closed on
Sep 6, 2001
Sold by
Myers Dennis
Bought by
Myers Dennis and Pier Thomas
Home Financials for this Owner
Home Financials are based on the most recent Mortgage that was taken out on this home.
Original Mortgage
$59,500
Interest Rate
6.53%
Purchase Details
Closed on
Nov 23, 1999
Sold by
March Stephen P
Bought by
Myers Dennis W
Home Financials for this Owner
Home Financials are based on the most recent Mortgage that was taken out on this home.
Original Mortgage
$48,000
Interest Rate
7.97%
Purchase Details
Closed on
Mar 6, 1997
Sold by
Faiver Eric P
Bought by
March Stephen P
Create a Home Valuation Report for This Property
The Home Valuation Report is an in-depth analysis detailing your home's value as well as a comparison with similar homes in the area
Home Values in the Area
Average Home Value in this Area
Purchase History
| Date | Buyer | Sale Price | Title Company |
|---|---|---|---|
| Mccants Charles | -- | None Listed On Document | |
| Mccants Charles | $27,000 | None Available | |
| Alling Bruce | $69,000 | Bell Title Company | |
| Kim Pier Thomas | -- | Bell Title Company | |
| Myers Dennis | -- | -- | |
| Myers Dennis W | $58,500 | Transnation Title | |
| March Stephen P | $23,500 | -- |
Source: Public Records
Mortgage History
| Date | Status | Borrower | Loan Amount |
|---|---|---|---|
| Open | Mccants Charles | $50,000 | |
| Previous Owner | Alling Bruce | $59,800 | |
| Previous Owner | Myers Dennis | $59,500 | |
| Previous Owner | Myers Dennis W | $48,000 |
Source: Public Records
Tax History Compared to Growth
Tax History
| Year | Tax Paid | Tax Assessment Tax Assessment Total Assessment is a certain percentage of the fair market value that is determined by local assessors to be the total taxable value of land and additions on the property. | Land | Improvement |
|---|---|---|---|---|
| 2024 | $35 | $63,300 | $3,500 | $59,800 |
| 2023 | $4,096 | $51,200 | $3,500 | $47,700 |
| 2022 | $3,744 | $46,000 | $3,900 | $42,100 |
| 2021 | $2,899 | $42,300 | $6,000 | $36,300 |
| 2020 | $2,877 | $38,400 | $6,000 | $32,400 |
| 2019 | $2,774 | $36,900 | $6,000 | $30,900 |
| 2018 | $2,635 | $33,700 | $6,000 | $27,700 |
| 2017 | $2,534 | $33,700 | $6,000 | $27,700 |
| 2016 | $2,434 | $33,100 | $6,000 | $27,100 |
| 2015 | $2,434 | $32,100 | $12,092 | $20,008 |
| 2014 | $2,434 | $31,200 | $15,750 | $15,450 |
Source: Public Records
Map
Nearby Homes
- 312 W Saginaw St Unit 1
- 413 W Oakland Ave
- 824 N Pine St
- 605 Seymour Ave
- 603 Seymour Ave
- 824 Seymour Ave
- 521 Seymour Ave
- 320 W Genesee St
- 526 N Sycamore St
- 927 N Chestnut St
- 900 Seymour Ave
- 904 Seymour Ave
- 513 W Kilborn St
- 910 Seymour Ave
- 616 W Genesee St
- 909 N Sycamore St
- 908 N Capitol Ave
- 916 Wisconsin Ave
- 609 W Shiawassee St
- 1032 Seymour Ave
- 716 N Chestnut St Unit 1
- 718 N Chestnut St
- 710 N Chestnut St
- 722 N Chestnut St
- 708 N Chestnut St
- 418 W Saginaw St
- 724 N Chestnut St Unit 1
- 724 N Chestnut St
- 422 W Saginaw St Unit Lower
- 422 W Saginaw St Unit Upper
- 422 W Saginaw St
- 419 W West Madison
- 420 W Saginaw St
- 416 W Saginaw St
- 416 W Saginaw St Unit 1st Floor
- 416 W Saginaw St Unit 2nd Floor
- 723 N Walnut St
- 421 W Madison St
- 425 W Madison St Unit 1
- 427 W Madison St Unit 1