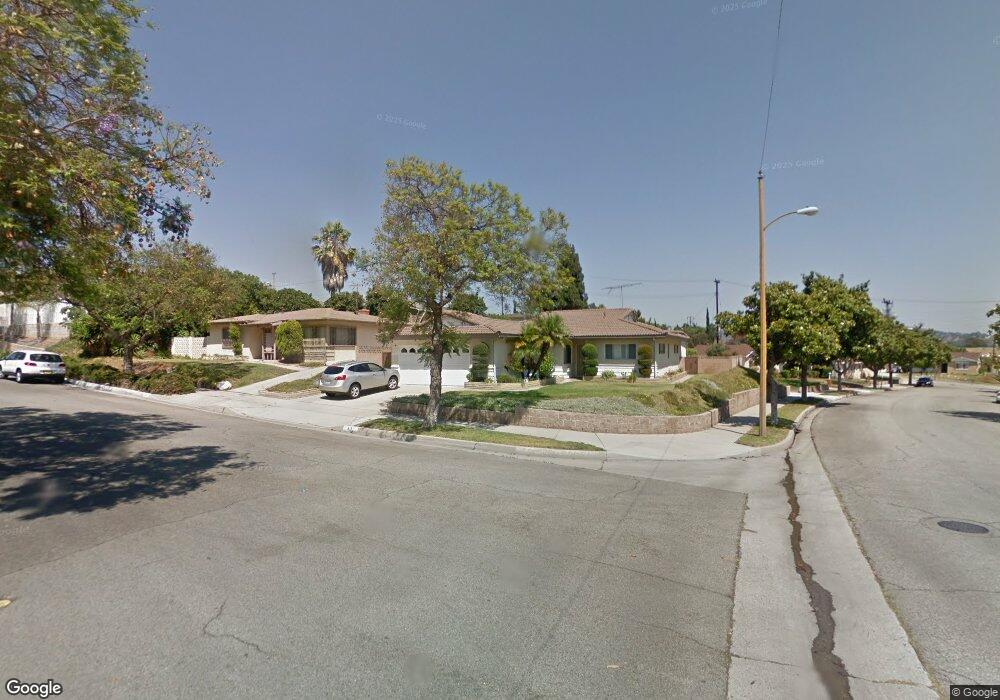
716 N Orcutt Dr Montebello, CA 90640
Estimated Value: $789,771 - $919,000
3
Beds
2
Baths
1,304
Sq Ft
$660/Sq Ft
Est. Value
About This Home
This home is located at 716 N Orcutt Dr, Montebello, CA 90640 and is currently estimated at $860,943, approximately $660 per square foot. 716 N Orcutt Dr is a home located in Los Angeles County with nearby schools including La Merced Elementary School, La Merced Intermediate School, and Montebello High School.
Ownership History
Date
Name
Owned For
Owner Type
Purchase Details
Closed on
Aug 22, 2018
Sold by
Leung Teresa Y
Bought by
Leung Teresa Yiu Ting and Leung Teresa Yiu
Current Estimated Value
Purchase Details
Closed on
Feb 25, 2011
Sold by
Leung Teresa
Bought by
Leung Teresa Y and Leung Teresa
Home Financials for this Owner
Home Financials are based on the most recent Mortgage that was taken out on this home.
Original Mortgage
$175,000
Outstanding Balance
$8,014
Interest Rate
4.67%
Mortgage Type
New Conventional
Estimated Equity
$852,929
Purchase Details
Closed on
Jul 17, 1999
Sold by
Leung Teresa
Bought by
Leung Teresa
Home Financials for this Owner
Home Financials are based on the most recent Mortgage that was taken out on this home.
Original Mortgage
$80,000
Interest Rate
7.51%
Create a Home Valuation Report for This Property
The Home Valuation Report is an in-depth analysis detailing your home's value as well as a comparison with similar homes in the area
Home Values in the Area
Average Home Value in this Area
Purchase History
| Date | Buyer | Sale Price | Title Company |
|---|---|---|---|
| Leung Teresa Yiu Ting | -- | None Available | |
| Leung Teresa Y | -- | Advantage Title Inc | |
| Leung Teresa | -- | First American Title Co |
Source: Public Records
Mortgage History
| Date | Status | Borrower | Loan Amount |
|---|---|---|---|
| Open | Leung Teresa Y | $175,000 | |
| Closed | Leung Teresa | $80,000 |
Source: Public Records
Tax History Compared to Growth
Tax History
| Year | Tax Paid | Tax Assessment Tax Assessment Total Assessment is a certain percentage of the fair market value that is determined by local assessors to be the total taxable value of land and additions on the property. | Land | Improvement |
|---|---|---|---|---|
| 2025 | $4,148 | $255,664 | $141,955 | $113,709 |
| 2024 | $4,148 | $250,652 | $139,172 | $111,480 |
| 2023 | $4,126 | $245,739 | $136,444 | $109,295 |
| 2022 | $3,989 | $240,921 | $133,769 | $107,152 |
| 2021 | $3,842 | $236,198 | $131,147 | $105,051 |
| 2019 | $3,663 | $229,194 | $127,258 | $101,936 |
| 2018 | $3,623 | $224,701 | $124,763 | $99,938 |
| 2017 | $3,545 | $220,296 | $122,317 | $97,979 |
| 2016 | $3,466 | $215,977 | $119,919 | $96,058 |
| 2015 | $3,292 | $212,734 | $118,118 | $94,616 |
| 2014 | $3,253 | $208,568 | $115,805 | $92,763 |
Source: Public Records
Map
Nearby Homes
- 348 E Lincoln Ave
- 653 N Raywood Ave
- 1004 N Las Flores Ave
- 1012 Burke Dr
- 8939 Gallatin Rd Unit 71
- 225 Remy Ln
- 25 Remy Ln
- 55 Remy Ln
- 58 Remy Ln
- 38 Remy Ln
- 115 Remy Ln
- 75 Remy Ln
- 8509 Beverly Blvd
- 8509 Beverly Blvd Unit 121
- Apex Plan at Metro Heights - Viewpoint
- Compass Plan at Metro Heights - Viewpoint
- Spectrum Plan at Metro Heights - Viewpoint
- 424 Bradley Ave
- 555 Canterbury Way
- 545 Canterbury Way
- 720 N Orcutt Dr
- 712 N Orcutt Dr
- 730 N Orcutt Dr
- 708 N Orcutt Dr
- 721 Espelette Place
- 720 N Lincoln Ave
- 717 N Orcutt Dr
- 716 N Lincoln Ave
- 740 N Orcutt Dr
- 712 N Lincoln Ave
- 704 N Orcutt Dr
- 713 N Orcutt Dr
- 708 N Lincoln Ave
- 728 N Lincoln Ave
- 744 N Orcutt Dr
- 408 N Orcutt Dr
- 741 N Orcutt Dr
- 725 Espelette Place
- 417 N Orcutt Dr
- 732 N Lincoln Ave