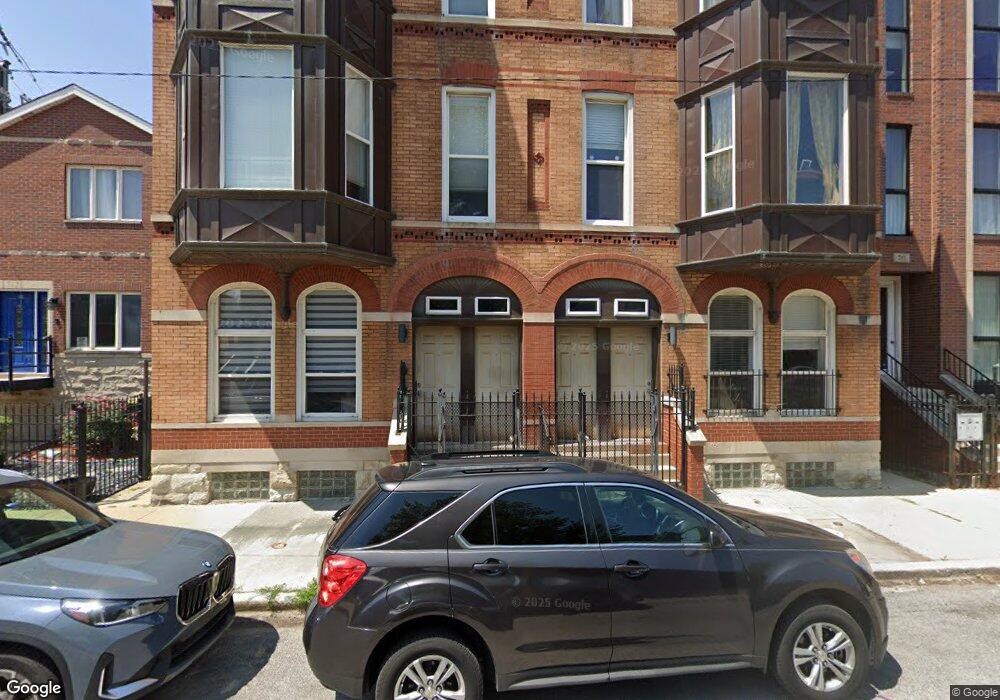
716 N Throop St Unit 7162F Chicago, IL 60642
West Town NeighborhoodEstimated Value: $227,715 - $692,000
1
Bed
1
Bath
750
Sq Ft
$480/Sq Ft
Est. Value
About This Home
This home is located at 716 N Throop St Unit 7162F, Chicago, IL 60642 and is currently estimated at $359,929, approximately $479 per square foot. 716 N Throop St Unit 7162F is a home located in Cook County with nearby schools including Otis Elementary School, Wells Community Academy High School, and Rauner College Prep.
Ownership History
Date
Name
Owned For
Owner Type
Purchase Details
Closed on
Sep 18, 2020
Sold by
Muscatu Zachary
Bought by
Muscato Zachary and Muscato Emily K
Current Estimated Value
Purchase Details
Closed on
Sep 1, 2006
Sold by
Schnotala Erik J and Schnotala Veronica
Bought by
Muscato Zachary
Home Financials for this Owner
Home Financials are based on the most recent Mortgage that was taken out on this home.
Original Mortgage
$172,800
Outstanding Balance
$102,066
Interest Rate
6.37%
Mortgage Type
Unknown
Estimated Equity
$257,863
Purchase Details
Closed on
May 2, 2005
Sold by
Casacasa Llc
Bought by
Schnotala Erik J and Schnotala Veronica
Home Financials for this Owner
Home Financials are based on the most recent Mortgage that was taken out on this home.
Original Mortgage
$155,900
Interest Rate
5.5%
Mortgage Type
Fannie Mae Freddie Mac
Create a Home Valuation Report for This Property
The Home Valuation Report is an in-depth analysis detailing your home's value as well as a comparison with similar homes in the area
Home Values in the Area
Average Home Value in this Area
Purchase History
| Date | Buyer | Sale Price | Title Company |
|---|---|---|---|
| Muscato Zachary | -- | Attorney | |
| Muscato Zachary | $216,000 | Heritage Title Company | |
| Schnotala Erik J | $195,000 | First American |
Source: Public Records
Mortgage History
| Date | Status | Borrower | Loan Amount |
|---|---|---|---|
| Open | Muscato Zachary | $172,800 | |
| Previous Owner | Schnotala Erik J | $155,900 | |
| Closed | Schnotala Erik J | $19,490 |
Source: Public Records
Tax History Compared to Growth
Tax History
| Year | Tax Paid | Tax Assessment Tax Assessment Total Assessment is a certain percentage of the fair market value that is determined by local assessors to be the total taxable value of land and additions on the property. | Land | Improvement |
|---|---|---|---|---|
| 2024 | $2,466 | $20,470 | $2,948 | $17,522 |
| 2023 | $2,376 | $14,971 | $1,345 | $13,626 |
| 2022 | $2,376 | $14,971 | $1,345 | $13,626 |
| 2021 | $2,341 | $14,970 | $1,345 | $13,625 |
| 2020 | $2,904 | $16,138 | $1,345 | $14,793 |
| 2019 | $2,886 | $17,795 | $1,345 | $16,450 |
| 2018 | $2,836 | $17,795 | $1,345 | $16,450 |
| 2017 | $3,083 | $17,695 | $1,186 | $16,509 |
| 2016 | $3,044 | $17,695 | $1,186 | $16,509 |
| 2015 | $2,762 | $17,695 | $1,186 | $16,509 |
| 2014 | $3,089 | $19,216 | $1,008 | $18,208 |
| 2013 | $3,017 | $19,216 | $1,008 | $18,208 |
Source: Public Records
Map
Nearby Homes
- 1322 W Huron St Unit 4N
- 1242 W Huron St
- 1409 W Superior St Unit 2F
- 1225 W Erie St
- 1203 W Superior St Unit 3C
- 1303 W Ohio St
- 1224 W Ohio St Unit 3
- 1244 W Ohio St Unit 2W
- 636 N Racine Ave Unit 2N
- 1432 W Erie St Unit 3
- 612 N Ogden Ave
- 525 N Ada St Unit 37
- 515 N Noble St Unit 306
- 613 N Ogden Ave Unit 2E
- 507 N Ada St
- 1156 W Ohio St Unit 2E
- 1454 W Ohio St
- 1402 W Grand Ave Unit 2
- 616 N May St Unit 3C
- 1327 W Grand Ave Unit 2W
- 716 N Throop St Unit 7163F
- 716 N Throop St Unit 7162R
- 716 N Throop St Unit 7161R
- 716 N Throop St Unit P4
- 716 N Throop St Unit 7163R
- 716 N Throop St Unit 1P
- 716 N Throop St Unit 2P
- 716 N Throop St Unit 3P
- 716 N Throop St Unit 7161F
- 716 N Throop St Unit P5
- 716 N Throop St Unit 3R
- 716 N Throop St Unit 2F
- 716 N Throop St Unit 3F
- 716 N Throop St Unit 2R
- 716 N Throop St Unit 1F
- 714 N Throop St Unit 7141R
- 714 N Throop St Unit 7143F
- 714 N Throop St Unit 7143R
- 714 N Throop St Unit 7142F
- 714 N Throop St Unit 7142R