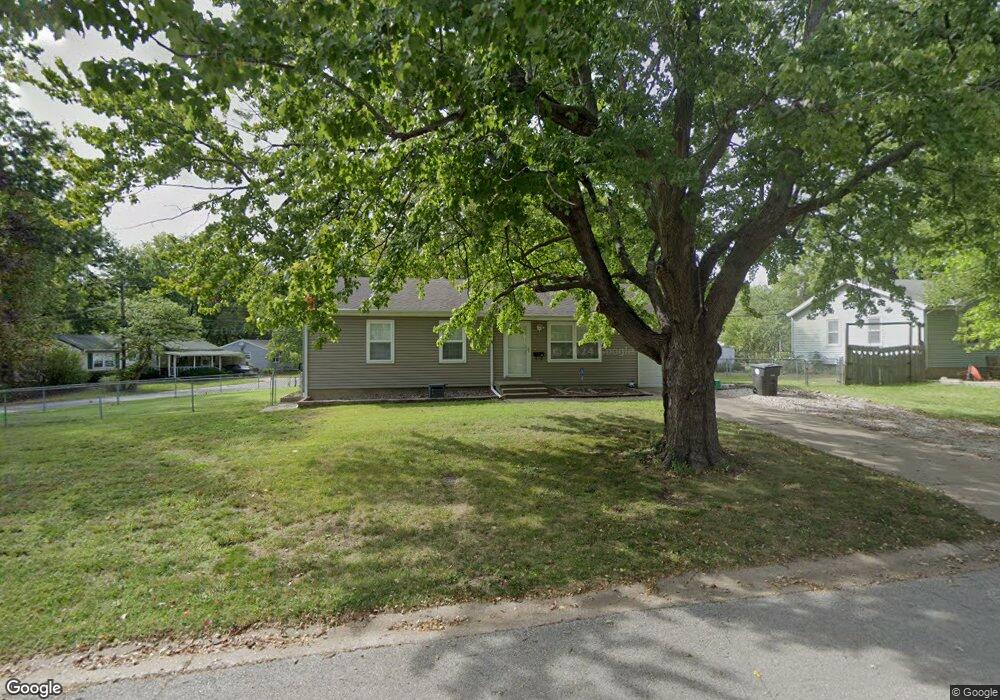
716 Pawnee Ln Belton, MO 64012
Estimated Value: $199,224 - $219,000
3
Beds
1
Bath
960
Sq Ft
$221/Sq Ft
Est. Value
About This Home
This home is located at 716 Pawnee Ln, Belton, MO 64012 and is currently estimated at $212,056, approximately $220 per square foot. 716 Pawnee Ln is a home located in Cass County with nearby schools including Cambridge Elementary School, Belton Middle School, and Mill Creek Upper Elementary School.
Ownership History
Date
Name
Owned For
Owner Type
Purchase Details
Closed on
Nov 18, 2009
Sold by
Mcdaniel Matthew E and Mcdaniel Natalie S
Bought by
Lacy Patrick
Current Estimated Value
Home Financials for this Owner
Home Financials are based on the most recent Mortgage that was taken out on this home.
Original Mortgage
$85,424
Outstanding Balance
$54,836
Interest Rate
4.83%
Mortgage Type
FHA
Estimated Equity
$157,220
Purchase Details
Closed on
Mar 21, 2008
Sold by
Fowler Jacob Ethan
Bought by
Mcdaniel Matthew E and Mcdaniel Natalie S
Purchase Details
Closed on
Nov 7, 2006
Sold by
Fowler Gary L
Bought by
Fowler Jacob Ethan
Create a Home Valuation Report for This Property
The Home Valuation Report is an in-depth analysis detailing your home's value as well as a comparison with similar homes in the area
Home Values in the Area
Average Home Value in this Area
Purchase History
| Date | Buyer | Sale Price | Title Company |
|---|---|---|---|
| Lacy Patrick | -- | Kansas City Title | |
| Mcdaniel Matthew E | -- | -- | |
| Fowler Jacob Ethan | -- | -- |
Source: Public Records
Mortgage History
| Date | Status | Borrower | Loan Amount |
|---|---|---|---|
| Open | Lacy Patrick | $85,424 |
Source: Public Records
Tax History
| Year | Tax Paid | Tax Assessment Tax Assessment Total Assessment is a certain percentage of the fair market value that is determined by local assessors to be the total taxable value of land and additions on the property. | Land | Improvement |
|---|---|---|---|---|
| 2025 | $1,487 | $20,220 | $2,540 | $17,680 |
| 2024 | $1,487 | $18,080 | $2,310 | $15,770 |
| 2023 | $1,487 | $18,080 | $2,310 | $15,770 |
| 2022 | $1,324 | $15,960 | $2,310 | $13,650 |
| 2021 | $1,324 | $15,960 | $2,310 | $13,650 |
| 2020 | $1,295 | $15,510 | $2,310 | $13,200 |
| 2019 | $1,268 | $15,510 | $2,310 | $13,200 |
| 2018 | $1,105 | $13,640 | $1,850 | $11,790 |
| 2017 | $970 | $13,640 | $1,850 | $11,790 |
| 2016 | $970 | $11,900 | $1,850 | $10,050 |
| 2015 | $970 | $11,900 | $1,850 | $10,050 |
| 2014 | $973 | $11,900 | $1,850 | $10,050 |
| 2013 | -- | $11,900 | $1,850 | $10,050 |
Source: Public Records
Map
Nearby Homes
- 702 Park Cir
- 210 Cherokee Dr
- 212 W Cambridge Rd
- 414 179th Terrace
- 200 Park Ave
- 416 Timbercreek Dr
- 000 Miller Dr
- 215 W Walnut St
- 104 E Sunrise Dr
- 117 Melody Ln
- 1105 Kent Dr
- 116 Hollywood Blvd
- 709 Mulberry St
- 602 S Cedar St
- 206-216 E South Ave
- 412 Mill St
- 507 3 St
- 205 Dawn Ave
- 1208 S Cedar St
- 506 Mill Ct
Your Personal Tour Guide
Ask me questions while you tour the home.