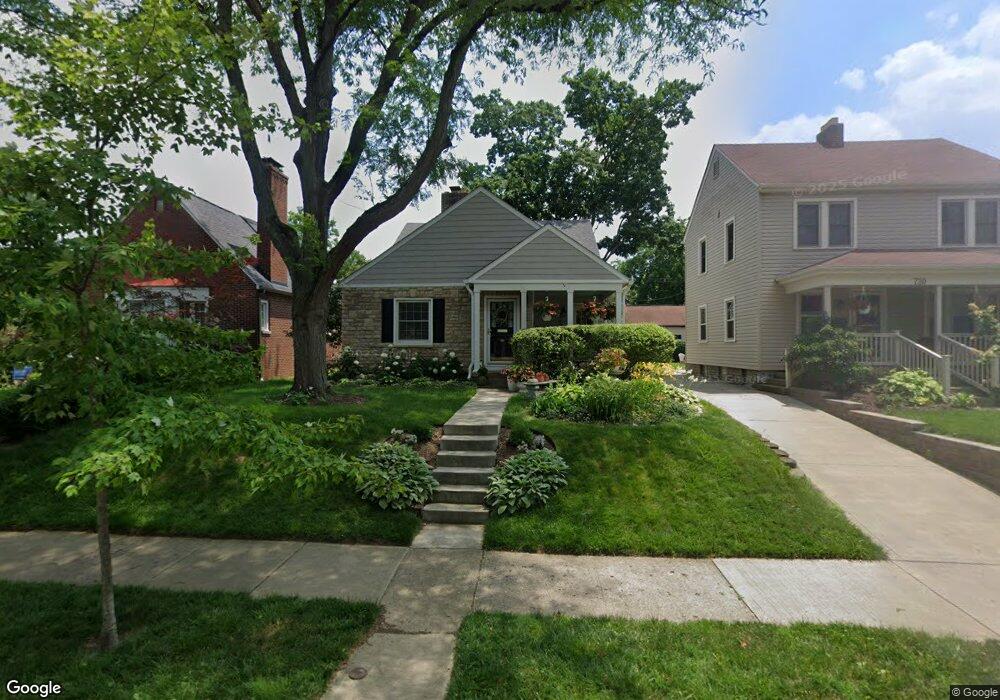
716 S Cassingham Rd Columbus, OH 43209
Estimated Value: $414,813 - $749,000
3
Beds
3
Baths
1,641
Sq Ft
$322/Sq Ft
Est. Value
About This Home
This home is located at 716 S Cassingham Rd, Columbus, OH 43209 and is currently estimated at $527,703, approximately $321 per square foot. 716 S Cassingham Rd is a home located in Franklin County with nearby schools including Montrose Elementary School, Bexley Middle School, and Bexley High School.
Ownership History
Date
Name
Owned For
Owner Type
Purchase Details
Closed on
Jun 26, 2017
Sold by
Niswander Christian and Niswander Jennifer
Bought by
Niswander Christian and Niswander Jennifer
Current Estimated Value
Home Financials for this Owner
Home Financials are based on the most recent Mortgage that was taken out on this home.
Original Mortgage
$190,000
Outstanding Balance
$100,514
Interest Rate
3.95%
Mortgage Type
New Conventional
Estimated Equity
$427,189
Purchase Details
Closed on
Apr 21, 2014
Sold by
Hill Jennifer and Niswander Christian
Bought by
Niswander Christian
Purchase Details
Closed on
Aug 29, 2003
Sold by
Sloan Claudia B and Sloan David L
Bought by
Hill Ryan and Hill Jennifer
Home Financials for this Owner
Home Financials are based on the most recent Mortgage that was taken out on this home.
Original Mortgage
$168,625
Interest Rate
5.37%
Mortgage Type
Purchase Money Mortgage
Purchase Details
Closed on
Jul 8, 1991
Bought by
Sloan David L and Sloan Claudia B
Purchase Details
Closed on
Jun 1, 1983
Create a Home Valuation Report for This Property
The Home Valuation Report is an in-depth analysis detailing your home's value as well as a comparison with similar homes in the area
Home Values in the Area
Average Home Value in this Area
Purchase History
| Date | Buyer | Sale Price | Title Company |
|---|---|---|---|
| Niswander Christian | -- | None Available | |
| Niswander Christian | -- | None Available | |
| Hill Jennifer | -- | None Available | |
| Hill Ryan | $177,500 | Bexley Title | |
| Sloan David L | -- | -- | |
| -- | $67,000 | -- |
Source: Public Records
Mortgage History
| Date | Status | Borrower | Loan Amount |
|---|---|---|---|
| Open | Niswander Christian | $190,000 | |
| Previous Owner | Hill Ryan | $168,625 |
Source: Public Records
Tax History Compared to Growth
Tax History
| Year | Tax Paid | Tax Assessment Tax Assessment Total Assessment is a certain percentage of the fair market value that is determined by local assessors to be the total taxable value of land and additions on the property. | Land | Improvement |
|---|---|---|---|---|
| 2024 | $6,358 | $114,490 | $41,340 | $73,150 |
| 2023 | $5,716 | $114,485 | $41,335 | $73,150 |
| 2022 | $5,705 | $91,770 | $20,020 | $71,750 |
| 2021 | $5,710 | $91,770 | $20,020 | $71,750 |
| 2020 | $5,659 | $91,770 | $20,020 | $71,750 |
| 2019 | $5,415 | $77,250 | $16,700 | $60,550 |
| 2018 | $4,514 | $77,250 | $16,700 | $60,550 |
| 2017 | $4,592 | $77,250 | $16,700 | $60,550 |
| 2016 | $4,310 | $66,260 | $15,890 | $50,370 |
| 2015 | $4,323 | $66,260 | $15,890 | $50,370 |
| 2014 | $4,347 | $66,260 | $15,890 | $50,370 |
| 2013 | $2,151 | $63,070 | $15,120 | $47,950 |
Source: Public Records
Map
Nearby Homes
- 782 S Remington Rd
- 696 Vernon Rd
- 891 Vernon Rd
- 1000 S Dawson Ave Unit 302
- 905 Vernon Rd
- 2425 Bryden Rd
- 895 Grandon Ave
- 789 Chelsea Ave
- 843 Kenwick Rd
- 866-868 Sheridan Ave
- 1052 S Roosevelt Ave
- 2430 Plymouth Ave
- 2770 Eastminster Rd
- 2455 Dale Ave
- 268 S Cassady Ave
- 419 Westland Ave
- 2856 Eastminster Rd
- 633 Eastmoor Blvd
- 616 Eastmoor Blvd Unit 478
- 1205 Kenwick Rd
- 710 S Cassingham Rd
- 720 S Cassingham Rd
- 726 S Cassingham Rd
- 730 S Cassingham Rd
- 698 S Cassingham Rd
- 723 Montrose Ave
- 727 Montrose Ave
- 717 Montrose Ave
- 736 S Cassingham Rd
- 735 Montrose Ave
- 694 S Cassingham Rd
- 711 S Cassingham Rd
- 709 S Cassingham Rd
- 717 S Cassingham Rd
- 725 S Cassingham Rd
- 705 Montrose Ave
- 743 Montrose Ave
- 688 S Cassingham Rd
- 729 S Cassingham Rd
- 697 S Cassingham Rd