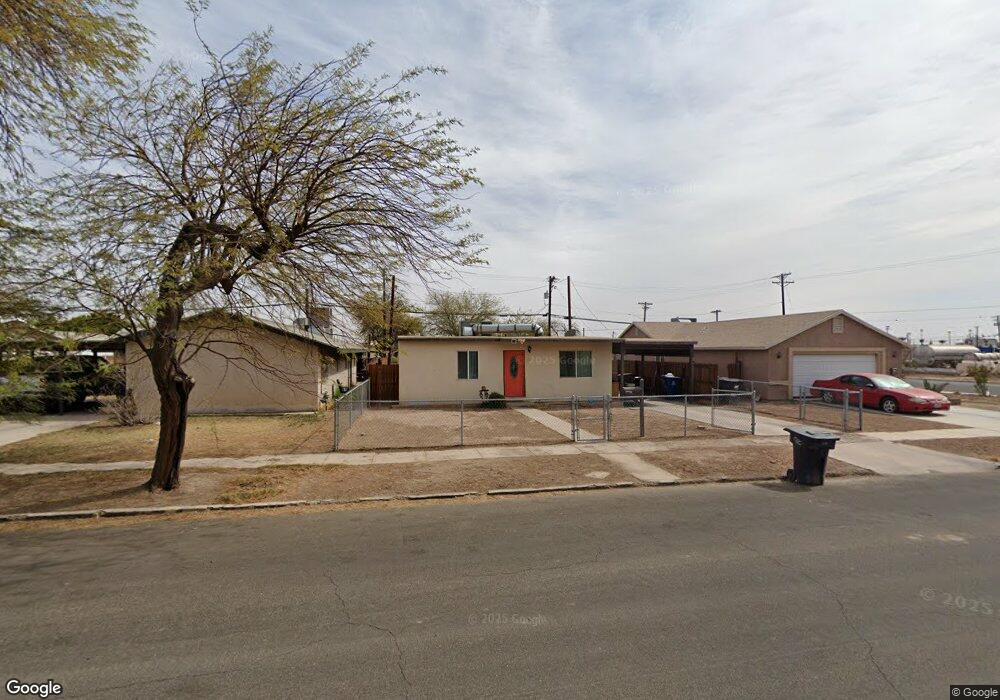
716 S H St Imperial, CA 92251
Estimated Value: $237,000 - $368,000
2
Beds
1
Bath
713
Sq Ft
$407/Sq Ft
Est. Value
About This Home
This home is located at 716 S H St, Imperial, CA 92251 and is currently estimated at $290,527, approximately $407 per square foot. 716 S H St is a home located in Imperial County with nearby schools including T.L. Waggoner Elementary School, Frank M. Wright Middle School, and Imperial High School.
Ownership History
Date
Name
Owned For
Owner Type
Purchase Details
Closed on
Nov 11, 2025
Sold by
Bravo Alejandro
Bought by
Bravo Nancy Elizabeth
Current Estimated Value
Home Financials for this Owner
Home Financials are based on the most recent Mortgage that was taken out on this home.
Original Mortgage
$173,250
Outstanding Balance
$172,756
Interest Rate
6.27%
Mortgage Type
New Conventional
Estimated Equity
$117,771
Purchase Details
Closed on
Sep 22, 2023
Sold by
Bravo Alejandro and Bravo Nancy
Bought by
Bravo Nancy Elizabeth and Bravo Alejandro
Home Financials for this Owner
Home Financials are based on the most recent Mortgage that was taken out on this home.
Original Mortgage
$165,000
Interest Rate
6.96%
Mortgage Type
New Conventional
Purchase Details
Closed on
Oct 7, 2022
Sold by
Collins Howard Leon
Bought by
Bravo Alejandro and Bravo Nancy
Purchase Details
Closed on
Jan 21, 2012
Sold by
Collins Lucile K
Bought by
Collins Travis
Purchase Details
Closed on
Mar 10, 1998
Sold by
Parker Margaret J
Bought by
Collins Lucile K
Create a Home Valuation Report for This Property
The Home Valuation Report is an in-depth analysis detailing your home's value as well as a comparison with similar homes in the area
Purchase History
| Date | Buyer | Sale Price | Title Company |
|---|---|---|---|
| Bravo Nancy Elizabeth | -- | Chicago Title Company | |
| Bravo Nancy Elizabeth | -- | Chicago Title Company | |
| Bravo Alejandro | $62,000 | Chicago Title | |
| Collins Travis | -- | None Available | |
| Collins Lucile K | -- | None Available |
Source: Public Records
Mortgage History
| Date | Status | Borrower | Loan Amount |
|---|---|---|---|
| Open | Bravo Nancy Elizabeth | $173,250 | |
| Previous Owner | Bravo Nancy Elizabeth | $165,000 |
Source: Public Records
Tax History
| Year | Tax Paid | Tax Assessment Tax Assessment Total Assessment is a certain percentage of the fair market value that is determined by local assessors to be the total taxable value of land and additions on the property. | Land | Improvement |
|---|---|---|---|---|
| 2025 | $2,327 | $213,282 | $52,020 | $161,262 |
| 2023 | $2,327 | $205,000 | $50,000 | $155,000 |
| 2022 | $295 | $25,407 | $6,911 | $18,496 |
| 2021 | $290 | $24,910 | $6,776 | $18,134 |
| 2020 | $287 | $24,656 | $6,707 | $17,949 |
| 2019 | $284 | $24,174 | $6,576 | $17,598 |
| 2018 | $280 | $23,701 | $6,448 | $17,253 |
| 2017 | $264 | $23,237 | $6,322 | $16,915 |
| 2016 | $255 | $22,783 | $6,199 | $16,584 |
| 2015 | $258 | $22,441 | $6,106 | $16,335 |
| 2014 | $241 | $22,003 | $5,987 | $16,016 |
Source: Public Records
Map
Nearby Homes
Your Personal Tour Guide
Ask me questions while you tour the home.