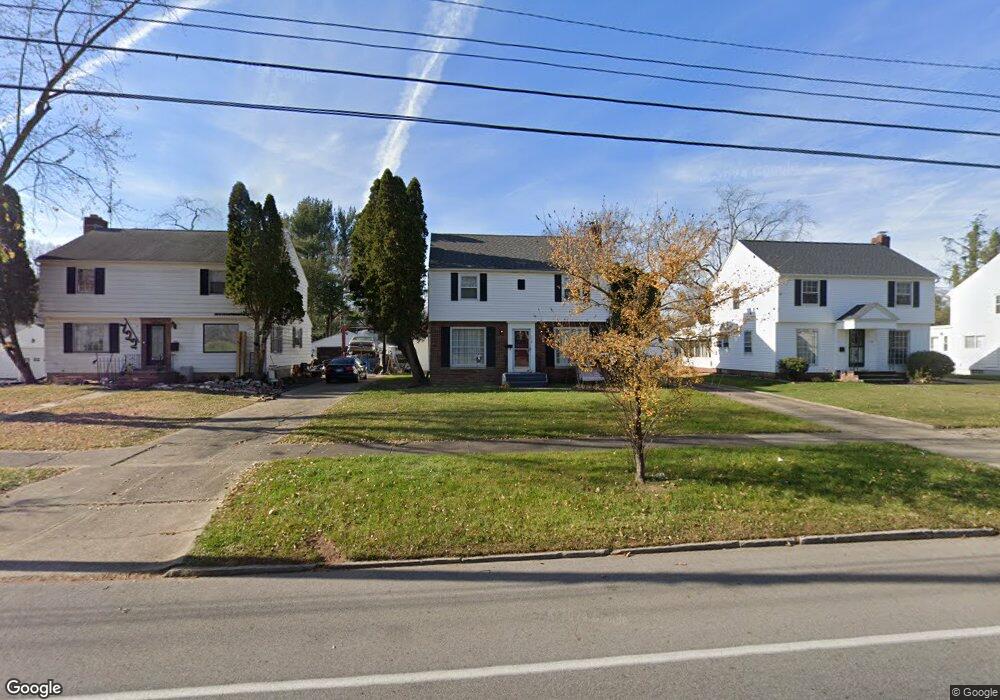
716 S Hawkins Ave Akron, OH 44320
West Akron NeighborhoodEstimated Value: $148,000 - $170,031
3
Beds
2
Baths
1,588
Sq Ft
$100/Sq Ft
Est. Value
About This Home
This home is located at 716 S Hawkins Ave, Akron, OH 44320 and is currently estimated at $158,258, approximately $99 per square foot. 716 S Hawkins Ave is a home located in Summit County with nearby schools including Summit Academy School, Emmanuel Christian Academy, and Julie Billiart School Akron.
Ownership History
Date
Name
Owned For
Owner Type
Purchase Details
Closed on
Feb 9, 2011
Sold by
Bey R Smith
Bought by
Bey R Smith and Bey Michelle Smith
Current Estimated Value
Purchase Details
Closed on
Apr 23, 2009
Sold by
Miller Andrew S and Miller Joanna L
Bought by
Bey R Smith
Home Financials for this Owner
Home Financials are based on the most recent Mortgage that was taken out on this home.
Original Mortgage
$82,700
Interest Rate
5.05%
Mortgage Type
VA
Purchase Details
Closed on
Sep 29, 2008
Sold by
Wells Fargo Bank Na
Bought by
Miller Andrew S
Purchase Details
Closed on
Apr 3, 2008
Sold by
Canty Stephanie
Bought by
Wells Fargo Bank Na and Asset Backed Pass Through Certificates S
Purchase Details
Closed on
Dec 30, 2004
Sold by
Washington Stanley R and Washington Thelma V
Bought by
Canty Stephanie
Home Financials for this Owner
Home Financials are based on the most recent Mortgage that was taken out on this home.
Original Mortgage
$105,400
Interest Rate
8.15%
Mortgage Type
Purchase Money Mortgage
Create a Home Valuation Report for This Property
The Home Valuation Report is an in-depth analysis detailing your home's value as well as a comparison with similar homes in the area
Home Values in the Area
Average Home Value in this Area
Purchase History
| Date | Buyer | Sale Price | Title Company |
|---|---|---|---|
| Bey R Smith | -- | None Available | |
| Bey R Smith | $81,000 | Rels Title | |
| Miller Andrew S | $36,000 | Chicago Title Insurance Co | |
| Wells Fargo Bank Na | $68,000 | None Available | |
| Canty Stephanie | $124,000 | Cleveland Home Title Agency |
Source: Public Records
Mortgage History
| Date | Status | Borrower | Loan Amount |
|---|---|---|---|
| Previous Owner | Bey R Smith | $82,700 | |
| Previous Owner | Canty Stephanie | $105,400 |
Source: Public Records
Tax History Compared to Growth
Tax History
| Year | Tax Paid | Tax Assessment Tax Assessment Total Assessment is a certain percentage of the fair market value that is determined by local assessors to be the total taxable value of land and additions on the property. | Land | Improvement |
|---|---|---|---|---|
| 2025 | $2,206 | $40,324 | $8,015 | $32,309 |
| 2024 | $2,206 | $40,324 | $8,015 | $32,309 |
| 2023 | $2,206 | $40,324 | $8,015 | $32,309 |
| 2022 | $2,004 | $28,599 | $5,684 | $22,915 |
| 2021 | $2,006 | $28,599 | $5,684 | $22,915 |
| 2020 | $1,976 | $28,600 | $5,680 | $22,920 |
| 2019 | $2,250 | $29,860 | $5,680 | $24,180 |
| 2018 | $2,220 | $29,860 | $5,680 | $24,180 |
| 2017 | $2,493 | $29,860 | $5,680 | $24,180 |
| 2016 | $2,495 | $33,220 | $5,680 | $27,540 |
| 2015 | $2,493 | $33,220 | $5,680 | $27,540 |
| 2014 | $2,474 | $33,220 | $5,680 | $27,540 |
| 2013 | $2,515 | $34,540 | $5,680 | $28,860 |
Source: Public Records
Map
Nearby Homes
- 632 Orlando Ave
- 773 Seward Ave
- 724 Hayden Ave
- 693 Roslyn Ave
- 739 Roslyn Ave
- 1390 Delia Ave
- 829 S Hawkins Ave
- 815 Hayden Ave
- 763 Cordova Ave
- 571 Crestview Ave
- 560 Mineola Ave
- 1333 Orrin St
- 1381 Orrin St
- 911 Hayden Ave
- 616 Dorchester Rd
- 454 Roslyn Ave
- 419 Dorchester Rd
- 601 Glendora Ave
- 589 Glendora Ave
- S/L 40 W Sunset View Dr
- 710 S Hawkins Ave
- 722 S Hawkins Ave
- 715 Nome Ave
- 728 S Hawkins Ave
- 709 Nome Ave
- 727 Nome Ave
- 703 Nome Ave
- 711 S Hawkins Ave
- 734 S Hawkins Ave
- 700 S Hawkins Ave
- 717 S Hawkins Ave
- 733 Nome Ave
- 695 Nome Ave
- 707 S Hawkins Ave
- 725 S Hawkins Ave
- 740 S Hawkins Ave
- 701 S Hawkins Ave
- 731 S Hawkins Ave
- 739 Nome Ave
- 714 Nome Ave