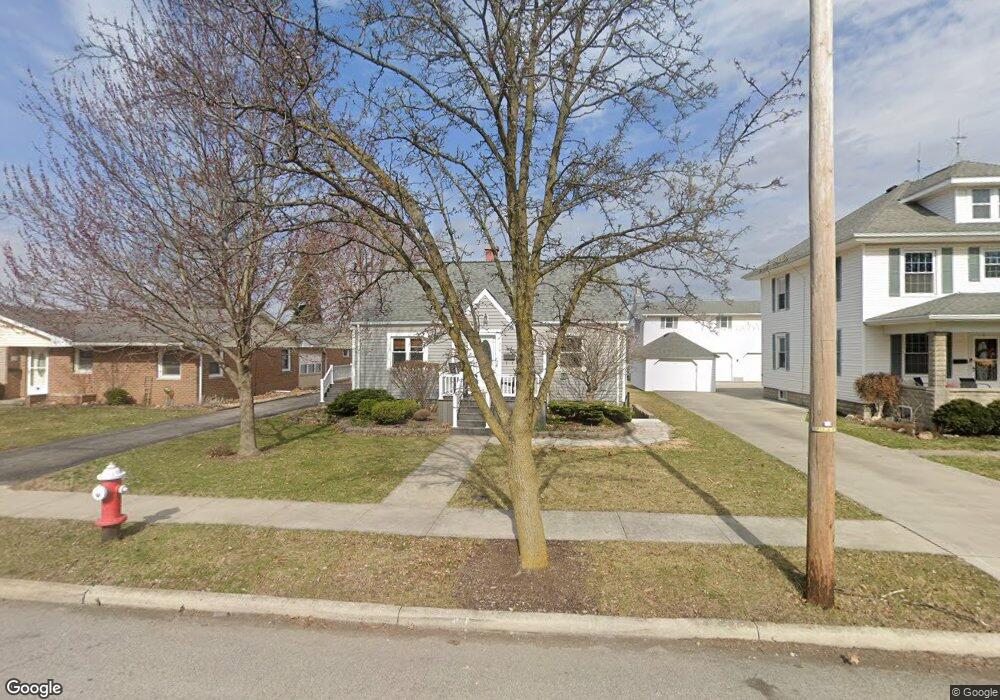
716 S Main St Bluffton, OH 45817
Estimated Value: $198,047 - $240,000
3
Beds
1
Bath
1,398
Sq Ft
$157/Sq Ft
Est. Value
About This Home
This home is located at 716 S Main St, Bluffton, OH 45817 and is currently estimated at $220,012, approximately $157 per square foot. 716 S Main St is a home located in Allen County with nearby schools including Bluffton Elementary School, Bluffton Middle School, and Bluffton High School.
Ownership History
Date
Name
Owned For
Owner Type
Purchase Details
Closed on
Mar 10, 2021
Sold by
Kinn Jon B and Kinn Mandy M
Bought by
Matthew Diller
Current Estimated Value
Home Financials for this Owner
Home Financials are based on the most recent Mortgage that was taken out on this home.
Original Mortgage
$105,000
Outstanding Balance
$94,125
Interest Rate
2.7%
Mortgage Type
New Conventional
Estimated Equity
$125,887
Purchase Details
Closed on
Mar 21, 2006
Sold by
Kinn Jon B and Baucher Mandy M
Bought by
Kinn Jon B and Kinn Mandy M
Purchase Details
Closed on
May 4, 1998
Sold by
Cline Vicki
Bought by
Kinn Jon and Baucher Mandy
Home Financials for this Owner
Home Financials are based on the most recent Mortgage that was taken out on this home.
Original Mortgage
$58,500
Interest Rate
7.18%
Mortgage Type
New Conventional
Purchase Details
Closed on
Aug 28, 1996
Sold by
Jervis Mary
Bought by
Martin Aubrey and Martin Shirley
Purchase Details
Closed on
Oct 28, 1987
Bought by
Ricker Vicki L Veit
Create a Home Valuation Report for This Property
The Home Valuation Report is an in-depth analysis detailing your home's value as well as a comparison with similar homes in the area
Home Values in the Area
Average Home Value in this Area
Purchase History
| Date | Buyer | Sale Price | Title Company |
|---|---|---|---|
| Matthew Diller | $140,000 | None Available | |
| Kinn Jon B | -- | None Available | |
| Kinn Jon | $65,000 | -- | |
| Martin Aubrey | $30,000 | -- | |
| Ricker Vicki L Veit | $37,000 | -- |
Source: Public Records
Mortgage History
| Date | Status | Borrower | Loan Amount |
|---|---|---|---|
| Open | Matthew Diller | $105,000 | |
| Previous Owner | Kinn Jon | $58,500 |
Source: Public Records
Tax History
| Year | Tax Paid | Tax Assessment Tax Assessment Total Assessment is a certain percentage of the fair market value that is determined by local assessors to be the total taxable value of land and additions on the property. | Land | Improvement |
|---|---|---|---|---|
| 2024 | $1,814 | $53,520 | $10,010 | $43,510 |
| 2023 | $1,631 | $44,590 | $8,330 | $36,260 |
| 2022 | $1,647 | $44,590 | $8,330 | $36,260 |
| 2021 | $1,615 | $44,590 | $8,330 | $36,260 |
| 2020 | $1,306 | $32,590 | $7,980 | $24,610 |
| 2019 | $1,306 | $32,590 | $7,980 | $24,610 |
| 2018 | $1,313 | $32,590 | $7,980 | $24,610 |
| 2017 | $1,147 | $28,490 | $7,980 | $20,510 |
| 2016 | $1,160 | $28,490 | $7,980 | $20,510 |
| 2015 | $1,197 | $28,490 | $7,980 | $20,510 |
| 2014 | $1,197 | $28,600 | $7,740 | $20,860 |
| 2013 | $1,105 | $28,600 | $7,740 | $20,860 |
Source: Public Records
Map
Nearby Homes
- 327 Parkview Dr
- 329 Parkview Dr
- 331 Parkview Dr
- 321 Parkview Dr
- 333 Parkview Dr
- 319 Parkview Dr
- 317 Parkview Dr
- 315 Parkview Dr
- 307 Parkview Dr
- 301 Parkview Dr
- 303 Parkview Dr
- 305 Parkview Dr
- 513 S Jackson St
- 0 Columbus Grove-Bluffton Rd
- 307 S Main St Unit back
- 160 Chestnut Ln
- 151 S Lawn Ave
- 408 Cherry St
- 0 Ohio 103
- 222 N Lawn Ave
Your Personal Tour Guide
Ask me questions while you tour the home.