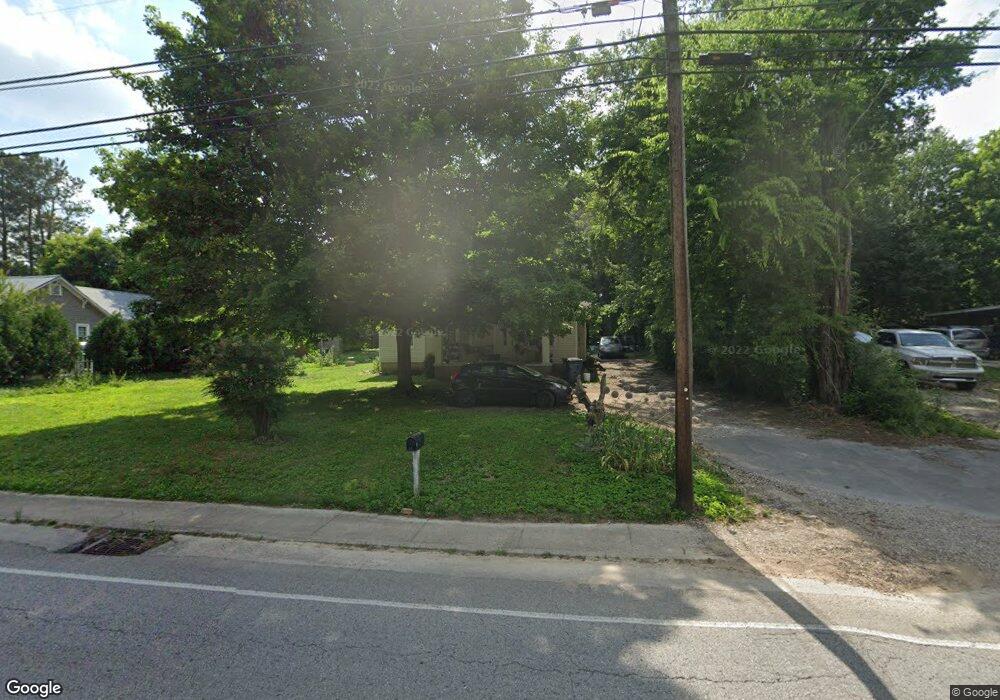
716 S Spring St Manchester, TN 37355
Estimated Value: $109,944 - $185,000
--
Bed
1
Bath
1,017
Sq Ft
$147/Sq Ft
Est. Value
About This Home
This home is located at 716 S Spring St, Manchester, TN 37355 and is currently estimated at $149,486, approximately $146 per square foot. 716 S Spring St is a home located in Coffee County with nearby schools including Westwood Middle School and Temple Baptist Christian School.
Ownership History
Date
Name
Owned For
Owner Type
Purchase Details
Closed on
Jun 25, 2009
Sold by
Alcorn Laura Ann Anderson
Bought by
Lawhorn Angela
Current Estimated Value
Home Financials for this Owner
Home Financials are based on the most recent Mortgage that was taken out on this home.
Original Mortgage
$69,387
Outstanding Balance
$44,286
Interest Rate
4.88%
Estimated Equity
$105,200
Purchase Details
Closed on
Feb 5, 2008
Sold by
Alcorn David Harris
Bought by
Alcorn Laura Ann Anderson
Purchase Details
Closed on
Mar 10, 1999
Sold by
Thaw Chester Life Estate
Bought by
Anderson Laura A
Create a Home Valuation Report for This Property
The Home Valuation Report is an in-depth analysis detailing your home's value as well as a comparison with similar homes in the area
Home Values in the Area
Average Home Value in this Area
Purchase History
| Date | Buyer | Sale Price | Title Company |
|---|---|---|---|
| Lawhorn Angela | $68,000 | -- | |
| Alcorn Laura Ann Anderson | -- | -- | |
| Anderson Laura A | $30,000 | -- |
Source: Public Records
Mortgage History
| Date | Status | Borrower | Loan Amount |
|---|---|---|---|
| Open | Anderson Laura A | $69,387 |
Source: Public Records
Tax History Compared to Growth
Tax History
| Year | Tax Paid | Tax Assessment Tax Assessment Total Assessment is a certain percentage of the fair market value that is determined by local assessors to be the total taxable value of land and additions on the property. | Land | Improvement |
|---|---|---|---|---|
| 2024 | $662 | $15,700 | $2,500 | $13,200 |
| 2023 | $662 | $15,700 | $0 | $0 |
| 2022 | $570 | $15,700 | $2,500 | $13,200 |
| 2021 | $581 | $12,700 | $2,500 | $10,200 |
| 2020 | $581 | $12,700 | $2,500 | $10,200 |
| 2019 | $581 | $12,700 | $2,500 | $10,200 |
| 2018 | $581 | $12,700 | $2,500 | $10,200 |
| 2017 | $634 | $12,075 | $2,500 | $9,575 |
| 2016 | $634 | $12,075 | $2,500 | $9,575 |
| 2015 | $633 | $12,075 | $2,500 | $9,575 |
| 2014 | $633 | $12,072 | $0 | $0 |
Source: Public Records
Map
Nearby Homes