Estimated Value: $180,000 - $213,000
3
Beds
1
Bath
918
Sq Ft
$222/Sq Ft
Est. Value
About This Home
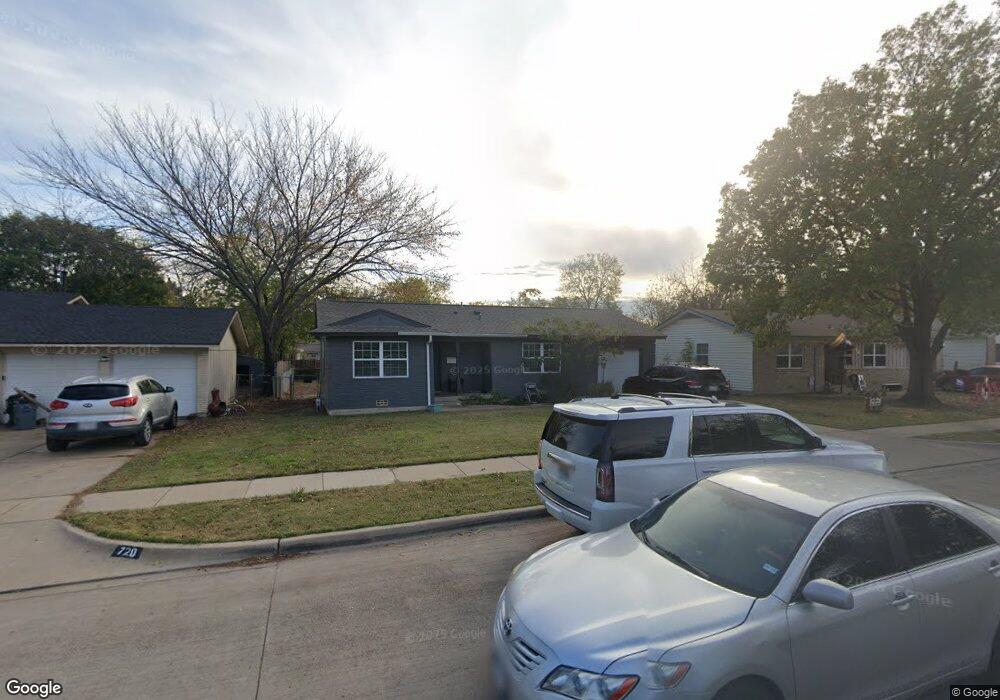
This home is located at 716 Tanglewood Dr, Hurst, TX 76053 and is currently estimated at $203,572, approximately $221 per square foot. 716 Tanglewood Dr is a home located in Tarrant County with nearby schools including Bellaire Elementary School, Hurst J High School, and L.D. Bell High School.
Ownership History
Date
Name
Owned For
Owner Type
Purchase Details
Closed on
Mar 4, 2024
Sold by
Howard Janet L
Bought by
Janet Howard Meegan Trust and Meegan
Current Estimated Value
Purchase Details
Closed on
Nov 13, 1996
Sold by
Turk Carroll C
Bought by
Howard Janet L
Home Financials for this Owner
Home Financials are based on the most recent Mortgage that was taken out on this home.
Original Mortgage
$49,949
Interest Rate
8.05%
Mortgage Type
FHA
Purchase Details
Closed on
Jul 13, 1995
Sold by
Wallace Temple E and Wallace Oleta
Bought by
Turk Carroll C
Home Financials for this Owner
Home Financials are based on the most recent Mortgage that was taken out on this home.
Original Mortgage
$44,370
Interest Rate
8%
Mortgage Type
Assumption
Create a Home Valuation Report for This Property
The Home Valuation Report is an in-depth analysis detailing your home's value as well as a comparison with similar homes in the area
Home Values in the Area
Average Home Value in this Area
Purchase History
| Date | Buyer | Sale Price | Title Company |
|---|---|---|---|
| Janet Howard Meegan Trust | -- | None Listed On Document | |
| Howard Janet L | -- | Commonwealth Land Title | |
| Turk Carroll C | -- | Rattikin Title Co |
Source: Public Records
Mortgage History
| Date | Status | Borrower | Loan Amount |
|---|---|---|---|
| Previous Owner | Howard Janet L | $49,949 | |
| Previous Owner | Turk Carroll C | $44,370 |
Source: Public Records
Tax History Compared to Growth
Tax History
| Year | Tax Paid | Tax Assessment Tax Assessment Total Assessment is a certain percentage of the fair market value that is determined by local assessors to be the total taxable value of land and additions on the property. | Land | Improvement |
|---|---|---|---|---|
| 2025 | $1,190 | $146,004 | $35,000 | $111,004 |
| 2024 | $1,190 | $169,148 | $35,000 | $134,148 |
| 2023 | $2,345 | $170,346 | $35,000 | $135,346 |
| 2022 | $2,450 | $165,778 | $35,000 | $130,778 |
| 2021 | $2,333 | $131,385 | $35,000 | $96,385 |
| 2020 | $2,116 | $123,842 | $35,000 | $88,842 |
| 2019 | $1,957 | $125,326 | $35,000 | $90,326 |
| 2018 | $612 | $72,673 | $19,000 | $53,673 |
| 2017 | $1,672 | $89,190 | $19,000 | $70,190 |
| 2016 | $1,520 | $90,096 | $19,000 | $71,096 |
| 2015 | $1,091 | $54,600 | $15,000 | $39,600 |
| 2014 | $1,091 | $54,600 | $15,000 | $39,600 |
Source: Public Records
Map
Nearby Homes
- 704 Tanglewood Dr
- 720 Tanglewood Dr
- 716 E Pecan St Unit 716 - 722
- 712 Brookfield Dr
- 1302 Woodridge Cir
- 1407 Woodridge Cir
- 1501 Woodridge Cir
- 1200 Tanglewood Trail
- 1309 Driftwood Dr
- 508 Oak Park Dr
- 803 Glenda Dr
- 832 Chateau Valee Cir
- 644 Caduceus Ln
- 802 Brown Trail
- 212 E Ellen Ave
- 849 Russell Ln
- 552 Norwood Dr
- 3905 Shady Creek Dr
- 120 Donald Dr
- 812 Forest Hollow Dr
- 712 Tanglewood Dr
- 724 Tanglewood Dr
- 708 Tanglewood Dr
- 717 Shady Ln
- 713 Shady Ln
- 721 Shady Ln
- 709 Shady Ln
- 717 Tanglewood Dr
- 728 Tanglewood Dr
- 721 Tanglewood Dr
- 713 Tanglewood Dr
- 725 Shady Ln
- 725 Tanglewood Dr
- 709 Tanglewood Dr
- 705 Shady Ln
- 732 Tanglewood Dr
- 729 Tanglewood Dr
- 705 Tanglewood Dr
- 700 Tanglewood Dr
- 729 Shady Ln