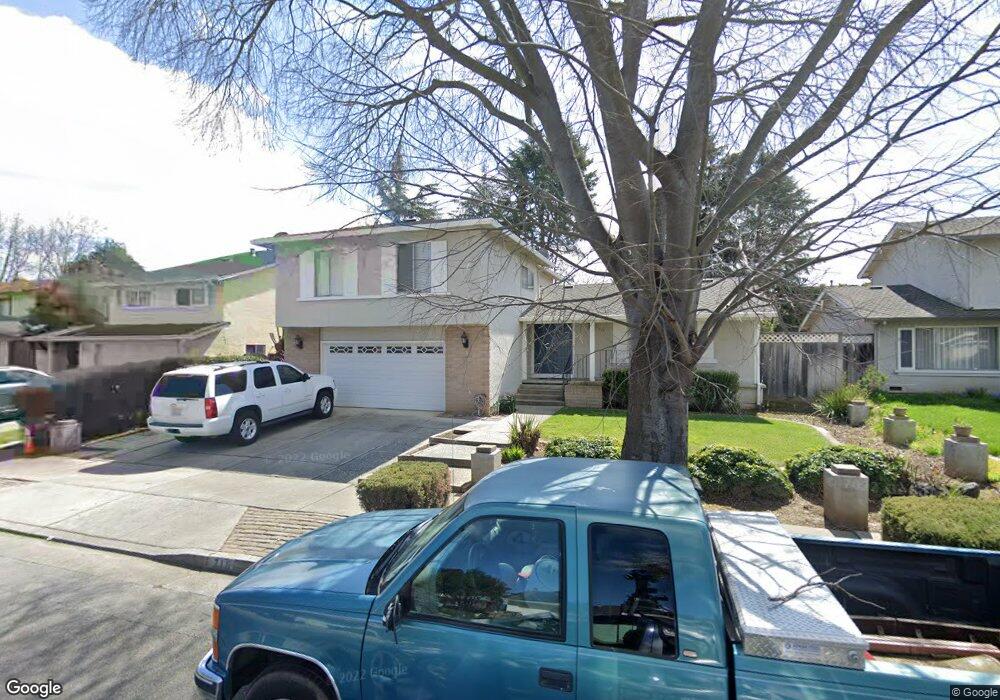
716 W 9th St Gilroy, CA 95020
Estimated Value: $965,000 - $1,028,000
4
Beds
3
Baths
2,059
Sq Ft
$482/Sq Ft
Est. Value
About This Home
This home is located at 716 W 9th St, Gilroy, CA 95020 and is currently estimated at $993,154, approximately $482 per square foot. 716 W 9th St is a home located in Santa Clara County with nearby schools including Glen View Elementary School, Solorsano Middle School, and Gilroy High School.
Ownership History
Date
Name
Owned For
Owner Type
Purchase Details
Closed on
May 24, 2016
Sold by
Torres Jesus and Torres Socorro
Bought by
Oseguera Jesus
Current Estimated Value
Home Financials for this Owner
Home Financials are based on the most recent Mortgage that was taken out on this home.
Original Mortgage
$440,000
Outstanding Balance
$349,355
Interest Rate
3.58%
Mortgage Type
New Conventional
Estimated Equity
$643,799
Purchase Details
Closed on
May 19, 2016
Sold by
Gonzalez Claudia Soledad Martinez
Bought by
Oseguera Jesus
Home Financials for this Owner
Home Financials are based on the most recent Mortgage that was taken out on this home.
Original Mortgage
$440,000
Outstanding Balance
$349,355
Interest Rate
3.58%
Mortgage Type
New Conventional
Estimated Equity
$643,799
Create a Home Valuation Report for This Property
The Home Valuation Report is an in-depth analysis detailing your home's value as well as a comparison with similar homes in the area
Home Values in the Area
Average Home Value in this Area
Purchase History
| Date | Buyer | Sale Price | Title Company |
|---|---|---|---|
| Oseguera Jesus | $550,000 | Chicago Title Company | |
| Oseguera Jesus | -- | Chicago Title Company |
Source: Public Records
Mortgage History
| Date | Status | Borrower | Loan Amount |
|---|---|---|---|
| Open | Oseguera Jesus | $440,000 |
Source: Public Records
Tax History
| Year | Tax Paid | Tax Assessment Tax Assessment Total Assessment is a certain percentage of the fair market value that is determined by local assessors to be the total taxable value of land and additions on the property. | Land | Improvement |
|---|---|---|---|---|
| 2025 | $7,948 | $651,080 | $358,095 | $292,985 |
| 2024 | $7,948 | $638,315 | $351,074 | $287,241 |
| 2023 | $7,902 | $625,800 | $344,191 | $281,609 |
| 2022 | $7,773 | $613,531 | $337,443 | $276,088 |
| 2021 | $7,738 | $601,502 | $330,827 | $270,675 |
| 2020 | $7,654 | $595,335 | $327,435 | $267,900 |
| 2019 | $7,583 | $583,663 | $321,015 | $262,648 |
| 2018 | $7,081 | $572,220 | $314,721 | $257,499 |
| 2017 | $7,230 | $561,000 | $308,550 | $252,450 |
| 2016 | $2,895 | $226,619 | $76,988 | $149,631 |
| 2015 | $2,732 | $223,216 | $75,832 | $147,384 |
| 2014 | $2,713 | $218,844 | $74,347 | $144,497 |
Source: Public Records
Map
Nearby Homes
- 745 Williamsburg Way
- 704 Lexington Place
- 7305 Orchard Dr
- 7344 Ailes Ct
- 7100 Potomac Place
- 500 W 10th St Unit 112
- 500 W 10th St Unit 140
- 500 W 10th St Unit 177
- 7351 Princevalle St Unit Homesite 18
- 7360 Ailes Ct
- 7379 Ailes Ct
- 7376 Ailes Ct
- 7384 Ailes Ct
- 700 Eschenburg Dr
- 6735 Stephan Ct
- 7460 Miller Ave
- 7051 Eigleberry St
- 6389 Tawhana Ln
- 60 Monte Vista Way
- 7490 Santa Theresa Dr Unit 10
- 710 W 9th St
- 720 W 9th St
- 715 Williamsburg Way Unit D
- 715 Williamsburg Way Unit D
- 715 Williamsburg Way Unit C
- 715 Williamsburg Way Unit B
- 715 Williamsburg Way Unit A
- 725 Williamsburg Way
- 721 Williamsburg Way
- 726 W 9th St
- 706 W 9th St
- 711 Williamsburg Way
- 731 Williamsburg Way
- 705 Williamsburg Way
- 721 W 9th St
- 735 Williamsburg Way
- 715 W 9th St
- 725 W 9th St
- 728 Williamsburg Way
- 730 W 9th St
Your Personal Tour Guide
Ask me questions while you tour the home.