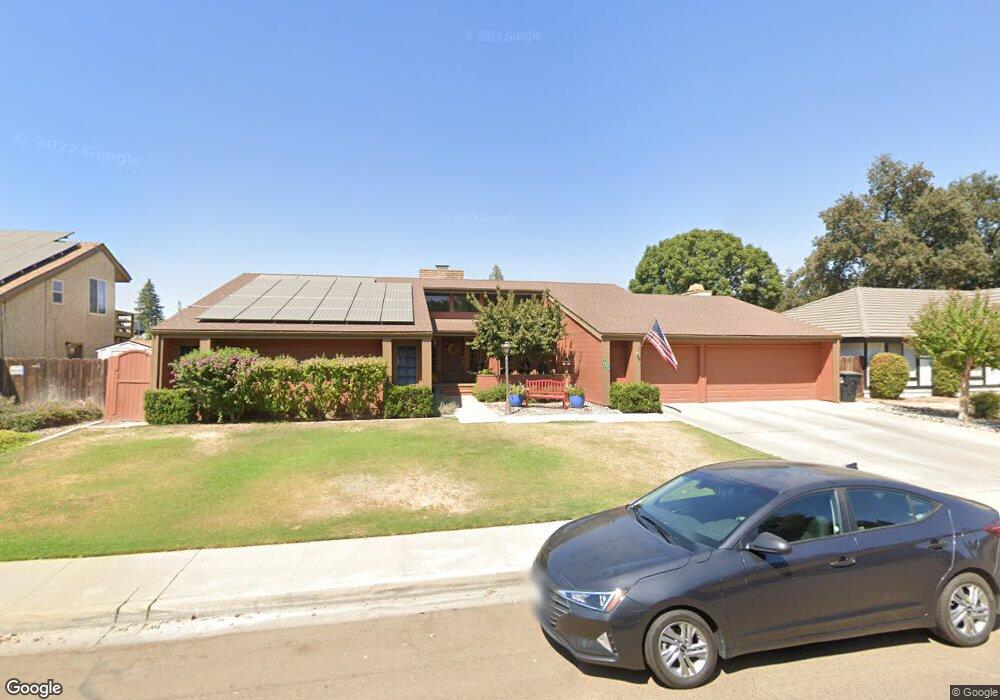
716 W Victor Ave Visalia, CA 93277
Mooney NeighborhoodEstimated Value: $497,980 - $589,000
4
Beds
2
Baths
2,380
Sq Ft
$228/Sq Ft
Est. Value
About This Home
This home is located at 716 W Victor Ave, Visalia, CA 93277 and is currently estimated at $542,995, approximately $228 per square foot. 716 W Victor Ave is a home located in Tulare County with nearby schools including Mountain View Elementary School, Divisadero Middle School, and Mt. Whitney High School.
Ownership History
Date
Name
Owned For
Owner Type
Purchase Details
Closed on
Sep 13, 2018
Sold by
Neves George A and Neves Melida A
Bought by
Neves George A and Neves Melinda Ann
Current Estimated Value
Purchase Details
Closed on
Dec 6, 2011
Sold by
Neves George A
Bought by
Neves George A and Neves Melinda A
Purchase Details
Closed on
Mar 17, 2006
Sold by
Neves George A
Bought by
Neves George A and Neves Melinda Ann
Purchase Details
Closed on
Mar 9, 2000
Sold by
Tsuhara Fred
Bought by
Neves George A and Neves Melinda A
Home Financials for this Owner
Home Financials are based on the most recent Mortgage that was taken out on this home.
Original Mortgage
$188,100
Interest Rate
8.24%
Mortgage Type
Purchase Money Mortgage
Create a Home Valuation Report for This Property
The Home Valuation Report is an in-depth analysis detailing your home's value as well as a comparison with similar homes in the area
Home Values in the Area
Average Home Value in this Area
Purchase History
| Date | Buyer | Sale Price | Title Company |
|---|---|---|---|
| Neves George A | -- | None Available | |
| Neves George A | -- | None Available | |
| Neves George A | -- | None Available | |
| Neves George A | $198,000 | Chicago Title Co |
Source: Public Records
Mortgage History
| Date | Status | Borrower | Loan Amount |
|---|---|---|---|
| Previous Owner | Neves George A | $188,100 |
Source: Public Records
Tax History Compared to Growth
Tax History
| Year | Tax Paid | Tax Assessment Tax Assessment Total Assessment is a certain percentage of the fair market value that is determined by local assessors to be the total taxable value of land and additions on the property. | Land | Improvement |
|---|---|---|---|---|
| 2025 | $3,206 | $304,331 | $84,536 | $219,795 |
| 2024 | $3,206 | $298,365 | $82,879 | $215,486 |
| 2023 | $3,118 | $292,515 | $81,254 | $211,261 |
| 2022 | $2,979 | $286,780 | $79,661 | $207,119 |
| 2021 | $2,983 | $281,157 | $78,099 | $203,058 |
| 2020 | $2,963 | $278,274 | $77,298 | $200,976 |
| 2019 | $2,873 | $272,817 | $75,782 | $197,035 |
| 2018 | $2,806 | $267,468 | $74,296 | $193,172 |
| 2017 | $2,771 | $262,223 | $72,839 | $189,384 |
| 2016 | $2,725 | $257,082 | $71,411 | $185,671 |
| 2015 | $2,647 | $253,220 | $70,338 | $182,882 |
| 2014 | $2,647 | $248,260 | $68,960 | $179,300 |
Source: Public Records
Map
Nearby Homes
- 2936 S Conyer St
- 3519 S Oak View Dr
- 2923 S Johnson St
- 2840 S West St
- 2905 S Encina St
- 1040 W Monte Vista Ave
- 610 W Kimball Ave
- 134 W Kimball Ave
- 816 W Loyola Ave
- 3439 S Lincoln Ct
- 3831 S Watson St
- 2528 S Watson St
- 2537 S Encina St
- 514 W Ashland Ct
- 1602 W Dorothea Ave
- 136 W Loyola Ave
- 3409 S Hall St
- 1216 W Evans Ave
- 1631 W Monte Vista Ave
- 1700 W La Vida Ave
- 730 W Victor Ave
- 704 W Victor Ave
- 713 W Dorothea Ave
- 725 W Dorothea Ave
- 703 W Dorothea Ave
- 735 W Dorothea Ave
- 721 W Victor Ave
- 744 W Victor Ave
- 642 W Victor Ave
- 643 W Dorothea Ave
- 745 W Dorothea Ave
- 741 W Victor Ave
- 641 W Victor Ave
- 808 W Victor Ave
- 3235 S Johnson Ct
- 718 W Dorothea Ave
- 633 W Dorothea Ave
- 805 W Dorothea Ave
- 704 W Dorothea Ave
- 630 W Victor Ave