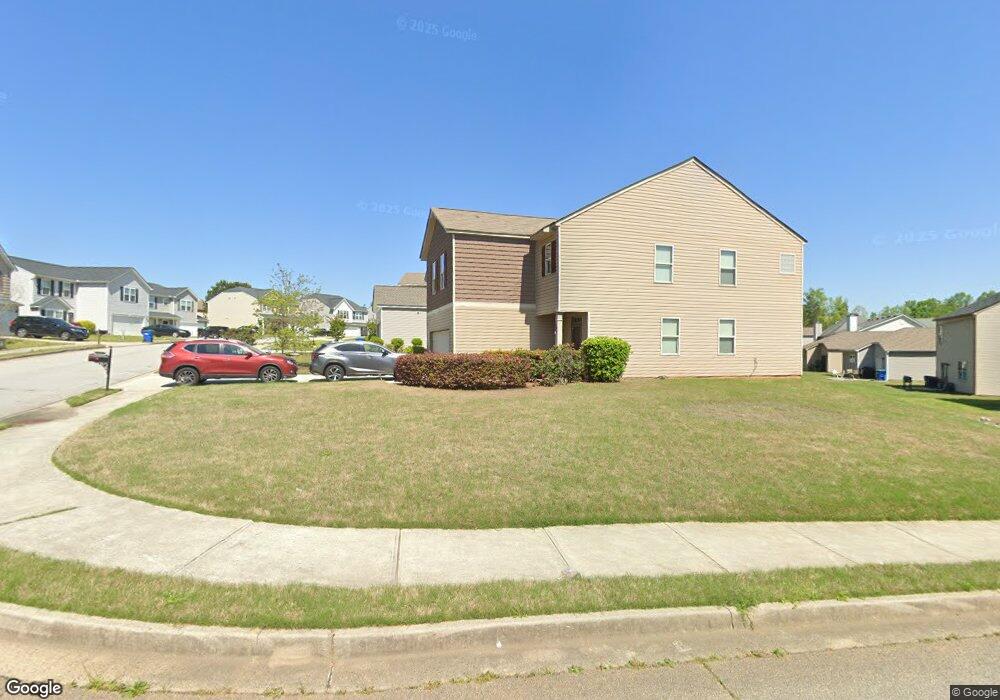
7160 Tanger Blvd Riverdale, GA 30296
Estimated Value: $256,000 - $295,000
3
Beds
3
Baths
1,682
Sq Ft
$164/Sq Ft
Est. Value
About This Home
This home is located at 7160 Tanger Blvd, Riverdale, GA 30296 and is currently estimated at $276,051, approximately $164 per square foot. 7160 Tanger Blvd is a home located in Fulton County with nearby schools including Nolan Elementary School, Mcnair Middle School, and Banneker High School.
Ownership History
Date
Name
Owned For
Owner Type
Purchase Details
Closed on
Aug 23, 2018
Sold by
Blair Anthony L
Bought by
Corria Yamila and Guevara Yanexy
Current Estimated Value
Home Financials for this Owner
Home Financials are based on the most recent Mortgage that was taken out on this home.
Original Mortgage
$142,590
Outstanding Balance
$123,834
Interest Rate
4.5%
Mortgage Type
New Conventional
Estimated Equity
$152,217
Purchase Details
Closed on
Jun 10, 2016
Sold by
D R Horton Inc
Bought by
Blair Anthony L
Home Financials for this Owner
Home Financials are based on the most recent Mortgage that was taken out on this home.
Original Mortgage
$131,562
Interest Rate
3.87%
Mortgage Type
FHA
Purchase Details
Closed on
Dec 11, 2014
Sold by
Bank Of Georgia
Bought by
Dr Horton Inc
Purchase Details
Closed on
Jun 9, 2014
Sold by
Northbridge Homes Llc
Bought by
The Bank Of Georgia
Create a Home Valuation Report for This Property
The Home Valuation Report is an in-depth analysis detailing your home's value as well as a comparison with similar homes in the area
Home Values in the Area
Average Home Value in this Area
Purchase History
| Date | Buyer | Sale Price | Title Company |
|---|---|---|---|
| Corria Yamila | $147,000 | -- | |
| Blair Anthony L | $133,990 | -- | |
| Dr Horton Inc | $640,000 | -- | |
| The Bank Of Georgia | $496,000 | -- |
Source: Public Records
Mortgage History
| Date | Status | Borrower | Loan Amount |
|---|---|---|---|
| Open | Corria Yamila | $142,590 | |
| Previous Owner | Blair Anthony L | $131,562 |
Source: Public Records
Tax History Compared to Growth
Tax History
| Year | Tax Paid | Tax Assessment Tax Assessment Total Assessment is a certain percentage of the fair market value that is determined by local assessors to be the total taxable value of land and additions on the property. | Land | Improvement |
|---|---|---|---|---|
| 2025 | $4,151 | $118,280 | $21,680 | $96,600 |
| 2023 | $3,042 | $107,760 | $28,840 | $78,920 |
| 2022 | $3,149 | $80,320 | $17,400 | $62,920 |
| 2021 | $2,621 | $65,480 | $14,160 | $51,320 |
| 2020 | $2,508 | $61,640 | $11,640 | $50,000 |
| 2019 | $1,989 | $50,360 | $9,280 | $41,080 |
| 2018 | $1,074 | $49,200 | $9,080 | $40,120 |
| 2017 | $972 | $23,840 | $4,280 | $19,560 |
| 2016 | $174 | $4,280 | $4,280 | $0 |
| 2015 | $175 | $4,280 | $4,280 | $0 |
| 2014 | $185 | $4,280 | $4,280 | $0 |
Source: Public Records
Map
Nearby Homes
- 2764 South Hills
- 2877 S Hills
- 2877 South Hills
- 2734 South Hills
- 1901 Creel Ln
- 2643 Haligan Point
- 7041 Livia Point
- 111 Creel Way Unit 22
- 2772 Haligan Point
- 3206 Pine Tree Trail Unit 15C
- 3402 Pine Tree Trail Unit 1A
- 7050 Galloway Point
- 2303 Pine Tree Trail
- 2565 Wood Bend Ln
- 703 Pine Tree Trail
- 701 Pine Tree Trail Unit 10
- 279 Sapphire Bend
- 602 Pine Tree Trail
- 2754 Topaz Rd
- 1608 Pine Tree Trail
- 7160 Tanger Blvd
- 7156 Tanger Blvd
- 7164 Tanger Blvd
- 7148 Tanger Blvd
- 995 Buloxi Blvd
- 985 Buloxi Blvd
- 0 Tanger Blvd Unit 8628402
- 0 Tanger Blvd Unit 3199757
- 0 Tanger Blvd Unit 7217465
- 0 Tanger Blvd Unit 7427982
- 0 Tanger Blvd Unit 9017234
- 0 Tanger Blvd Unit 7407917
- 0 Tanger Blvd Unit 7473250
- 0 Tanger Blvd Unit 7510546
- 0 Tanger Blvd Unit 7512926
- 0 Tanger Blvd Unit 7526230
- 0 Tanger Blvd Unit 7575521
- 0 Tanger Blvd Unit 8039222
- 0 Tanger Blvd
- 975 Buloxi Blvd