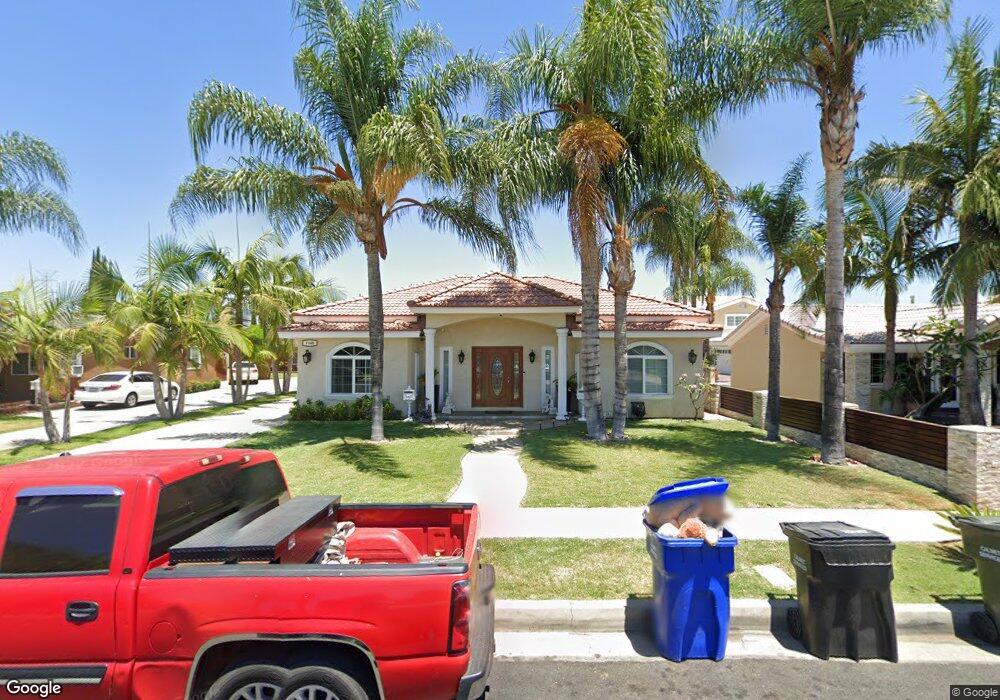
7169 Luxor St Downey, CA 90241
Estimated Value: $1,054,000 - $1,294,000
5
Beds
4
Baths
2,437
Sq Ft
$462/Sq Ft
Est. Value
About This Home
This home is located at 7169 Luxor St, Downey, CA 90241 and is currently estimated at $1,126,013, approximately $462 per square foot. 7169 Luxor St is a home located in Los Angeles County with nearby schools including Old River Elementary School, Williams Elementary School, and West Middle School.
Ownership History
Date
Name
Owned For
Owner Type
Purchase Details
Closed on
Jul 29, 2017
Sold by
Herrera Jose and Herrera Juana
Bought by
Herrera Jose and Herrera Juana
Current Estimated Value
Purchase Details
Closed on
Apr 8, 2002
Sold by
Barajas Ignacio and Herrera Jose G
Bought by
Herrera Jose and Herrera Juana
Home Financials for this Owner
Home Financials are based on the most recent Mortgage that was taken out on this home.
Original Mortgage
$240,000
Outstanding Balance
$95,789
Interest Rate
6.29%
Estimated Equity
$1,030,224
Purchase Details
Closed on
May 22, 2000
Sold by
Gonzalez Reymundo and Gonzalez Maria
Bought by
Barajas Ignacio and Herrera Jose G
Home Financials for this Owner
Home Financials are based on the most recent Mortgage that was taken out on this home.
Original Mortgage
$232,750
Interest Rate
8.27%
Create a Home Valuation Report for This Property
The Home Valuation Report is an in-depth analysis detailing your home's value as well as a comparison with similar homes in the area
Purchase History
We collect this data history from publicly available records. To have your information removed, we recommend requesting removal directly through your county’s website.
| Date | Buyer | Sale Price | Title Company |
|---|---|---|---|
| Herrera Jose | -- | None Available | |
| Herrera Jose | -- | United Title Company | |
| Barajas Ignacio | $245,000 | -- |
Source: Public Records
Mortgage History
We collect this data history from publicly available records. To have your information removed, we recommend requesting removal directly through your county’s website.
| Date | Status | Borrower | Loan Amount |
|---|---|---|---|
| Open | Herrera Jose | $240,000 | |
| Closed | Barajas Ignacio | $232,750 |
Source: Public Records
Tax History
| Year | Tax Paid | Tax Assessment Tax Assessment Total Assessment is a certain percentage of the fair market value that is determined by local assessors to be the total taxable value of land and additions on the property. | Land | Improvement |
|---|---|---|---|---|
| 2025 | $6,850 | $513,418 | $170,652 | $342,766 |
| 2024 | $6,709 | $503,352 | $167,306 | $336,046 |
| 2023 | $6,489 | $493,483 | $164,026 | $329,457 |
| 2022 | $6,175 | $483,808 | $160,810 | $322,998 |
| 2021 | $6,014 | $474,322 | $157,657 | $316,665 |
| 2020 | $5,925 | $469,459 | $156,041 | $313,418 |
| 2019 | $5,856 | $460,255 | $152,982 | $307,273 |
| 2018 | $5,587 | $451,232 | $149,983 | $301,249 |
| 2016 | $5,405 | $433,712 | $144,160 | $289,552 |
| 2015 | $5,328 | $427,198 | $141,995 | $285,203 |
| 2014 | $5,040 | $418,831 | $139,214 | $279,617 |
Source: Public Records
Map
Nearby Homes
- 7033 Stewart And Gray Rd Unit 6
- 7312 Neo St
- 11525 Haro Ave
- 11523 Old River School Rd
- 11517 Old River School Rd
- 11508 Old River School Rd
- 9643 Karmont Ave
- 9903 Karmont Ave
- 11033 Old River School Rd Unit 8
- 11648 Rives Ave
- 8328 Garfield Ave
- 5940 Cecilia St
- 10001 W Frontage Rd Unit 73
- 10001 W Frontage Rd Unit 175
- 10001 W Frontage Rd Unit 12
- 7304 Quill Dr Unit 182
- 7330 Quill Dr Unit 56
- 7330 Quill Dr Unit 59
- 7324 Quill Dr Unit 44
- 5678 Shull St
Your Personal Tour Guide
Ask me questions while you tour the home.