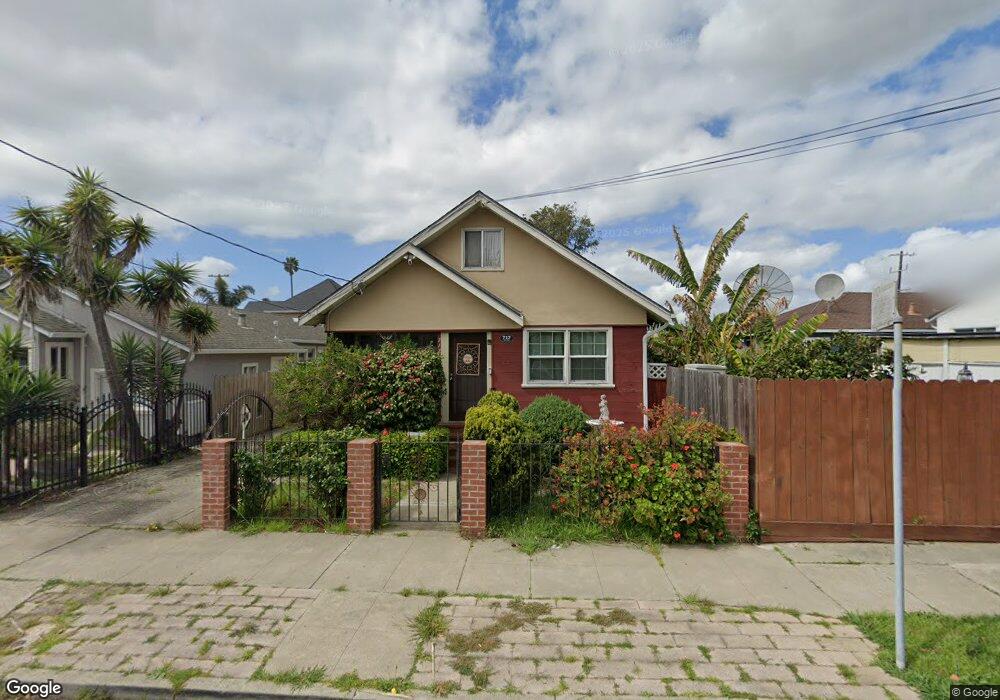
717 26th St Richmond, CA 94804
North & East NeighborhoodEstimated Value: $546,638 - $621,000
3
Beds
2
Baths
1,197
Sq Ft
$488/Sq Ft
Est. Value
About This Home
This home is located at 717 26th St, Richmond, CA 94804 and is currently estimated at $584,660, approximately $488 per square foot. 717 26th St is a home located in Contra Costa County with nearby schools including Michelle Obama School, Lovonya DeJean Middle School, and John F. Kennedy High School.
Ownership History
Date
Name
Owned For
Owner Type
Purchase Details
Closed on
May 18, 2010
Sold by
Montes Roberto Jose and Montes Jose Roberto
Bought by
Montes Roberto Jose
Current Estimated Value
Purchase Details
Closed on
Sep 19, 2007
Sold by
Montes Reina Carolina
Bought by
Montes Jose Roberto and Montes Ana Maria Alvarenga
Purchase Details
Closed on
Oct 4, 2005
Sold by
Montes Ana Maria Alvarenga and Montes Reina Carolina
Bought by
Montes Roberto Jose and Montes Ana Maria Alvarenga
Create a Home Valuation Report for This Property
The Home Valuation Report is an in-depth analysis detailing your home's value as well as a comparison with similar homes in the area
Home Values in the Area
Average Home Value in this Area
Purchase History
| Date | Buyer | Sale Price | Title Company |
|---|---|---|---|
| Montes Roberto Jose | -- | None Available | |
| Montes Jose Roberto | -- | None Available | |
| Montes Roberto Jose | -- | -- |
Source: Public Records
Tax History
| Year | Tax Paid | Tax Assessment Tax Assessment Total Assessment is a certain percentage of the fair market value that is determined by local assessors to be the total taxable value of land and additions on the property. | Land | Improvement |
|---|---|---|---|---|
| 2025 | $4,760 | $235,741 | $126,609 | $109,132 |
| 2024 | $4,620 | $231,120 | $124,127 | $106,993 |
| 2023 | $4,620 | $226,590 | $121,694 | $104,896 |
| 2022 | $4,511 | $222,148 | $119,308 | $102,840 |
| 2021 | $4,436 | $217,793 | $116,969 | $100,824 |
| 2019 | $4,158 | $211,335 | $113,500 | $97,835 |
| 2018 | $4,006 | $207,192 | $111,275 | $95,917 |
| 2017 | $3,901 | $203,131 | $109,094 | $94,037 |
| 2016 | $3,826 | $199,149 | $106,955 | $92,194 |
| 2015 | $3,786 | $196,159 | $105,349 | $90,810 |
| 2014 | $3,752 | $192,318 | $103,286 | $89,032 |
Source: Public Records
Map
Nearby Homes
- 2366 Gaynor Ave
- 2417 Esmond Ave
- 600 26th St Unit 606
- 626 28th St
- 559 Civic Center St
- 649 23rd St
- 2555 Barrett Ave
- 658 32nd St
- 653 20th St
- 444 28th St
- 2103 Visalia Ave
- 1929 Lincoln Ave
- 2110 Hellings Ave
- 2009 Coalinga Ave
- 674 35th St
- 3421 Roosevelt Ave
- 2620 Maricopa Ave
- 3428 Esmond Ave
- 1827 Barrett Ave
- 569 18th St
Your Personal Tour Guide
Ask me questions while you tour the home.