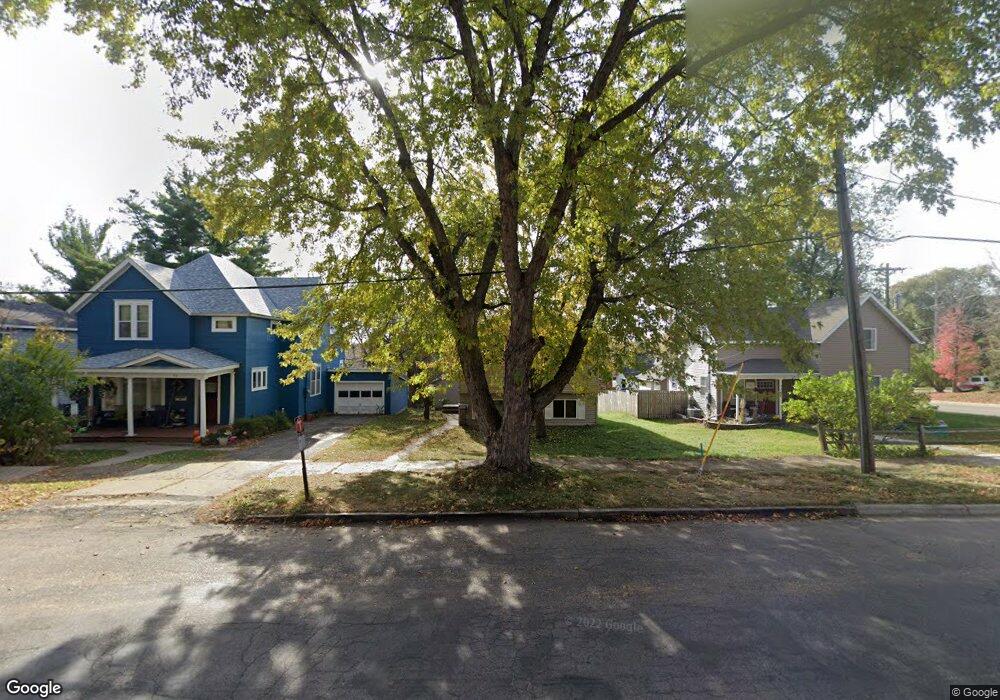
717 2nd Ave N Sauk Rapids, MN 56379
Estimated Value: $246,449 - $264,000
4
Beds
2
Baths
1,608
Sq Ft
$160/Sq Ft
Est. Value
About This Home
This home is located at 717 2nd Ave N, Sauk Rapids, MN 56379 and is currently estimated at $256,862, approximately $159 per square foot. 717 2nd Ave N is a home located in Benton County with nearby schools including Pleasant View Elementary School, Sauk Rapids-Rice Middle School, and Sauk Rapids-Rice Senior High School.
Ownership History
Date
Name
Owned For
Owner Type
Purchase Details
Closed on
Sep 15, 2020
Sold by
Naber James A
Bought by
Adams Kathy L and Leskey Tammi L
Current Estimated Value
Home Financials for this Owner
Home Financials are based on the most recent Mortgage that was taken out on this home.
Original Mortgage
$174,600
Interest Rate
2.9%
Mortgage Type
New Conventional
Purchase Details
Closed on
Sep 13, 2013
Sold by
Johnson Jay
Bought by
Naber James A
Home Financials for this Owner
Home Financials are based on the most recent Mortgage that was taken out on this home.
Original Mortgage
$78,000
Interest Rate
4.56%
Mortgage Type
New Conventional
Purchase Details
Closed on
Jun 16, 2005
Sold by
Oswald Robert E and Oswald Beth R
Bought by
Johnson Jay
Home Financials for this Owner
Home Financials are based on the most recent Mortgage that was taken out on this home.
Original Mortgage
$114,000
Interest Rate
5.62%
Mortgage Type
Adjustable Rate Mortgage/ARM
Create a Home Valuation Report for This Property
The Home Valuation Report is an in-depth analysis detailing your home's value as well as a comparison with similar homes in the area
Home Values in the Area
Average Home Value in this Area
Purchase History
| Date | Buyer | Sale Price | Title Company |
|---|---|---|---|
| Adams Kathy L | $180,000 | Burnet Title | |
| Naber James A | $128,000 | Home Title | |
| Johnson Jay | $142,500 | None Available |
Source: Public Records
Mortgage History
| Date | Status | Borrower | Loan Amount |
|---|---|---|---|
| Previous Owner | Adams Kathy L | $174,600 | |
| Previous Owner | Naber James A | $78,000 | |
| Previous Owner | Johnson | $108,400 | |
| Previous Owner | Johnson Jay | $114,000 |
Source: Public Records
Tax History Compared to Growth
Tax History
| Year | Tax Paid | Tax Assessment Tax Assessment Total Assessment is a certain percentage of the fair market value that is determined by local assessors to be the total taxable value of land and additions on the property. | Land | Improvement |
|---|---|---|---|---|
| 2025 | $3,560 | $239,600 | $25,000 | $214,600 |
| 2024 | $3,602 | $227,900 | $25,000 | $202,900 |
| 2023 | $2,498 | $230,100 | $25,000 | $205,100 |
| 2022 | $2,350 | $202,600 | $22,800 | $179,800 |
| 2021 | $2,132 | $176,900 | $22,800 | $154,100 |
| 2020 | $2,124 | $163,500 | $21,900 | $141,600 |
| 2018 | $1,814 | $123,300 | $18,332 | $104,968 |
| 2017 | $1,814 | $114,700 | $18,020 | $96,680 |
| 2016 | $1,778 | $131,400 | $21,900 | $109,500 |
| 2015 | $1,774 | $96,800 | $17,235 | $79,565 |
| 2014 | -- | $91,600 | $16,972 | $74,628 |
| 2013 | -- | $92,900 | $17,039 | $75,861 |
Source: Public Records
Map
Nearby Homes
- 601 4th Ave N
- 721 6th Ave N
- 803 6th Ave N
- 337 9 1 2 St N
- 32467 County Road 1
- 500 7th Ave N
- 2161 Mill Pond Dr
- 702 N Benton Dr
- 1150 N Benton Dr
- 14 4th Ave N
- 1212 Mill Creek Cir
- 110 11th St N
- 24 3rd Ave S
- 32 3rd Ave S
- 2016 Forest Ct
- 302 10th Ave N
- 1213 4 1/2 Ave N
- 2024 Forest Ct
- 401 2nd St S
- 113 5th Ave S
- 717 4 1/2 Ave N
- 721 2nd Ave N
- 713 2nd Ave N
- 709 2nd Ave N
- 705 4 1/2 Ave N
- 705 2nd Ave N
- 720 N Benton Dr
- 712 N Benton Dr
- 801 2nd Ave N
- 801 801 2nd Ave N
- 701 701 2nd Ave N
- 701 4 1/2 Ave N
- 701 2nd Ave N
- 720 2nd Ave N
- 712 2nd Ave N
- 800 N Benton Dr
- 702 2nd Ave N
- 201 8th St N
- 700 N Benton Dr
- 811 2nd Ave N