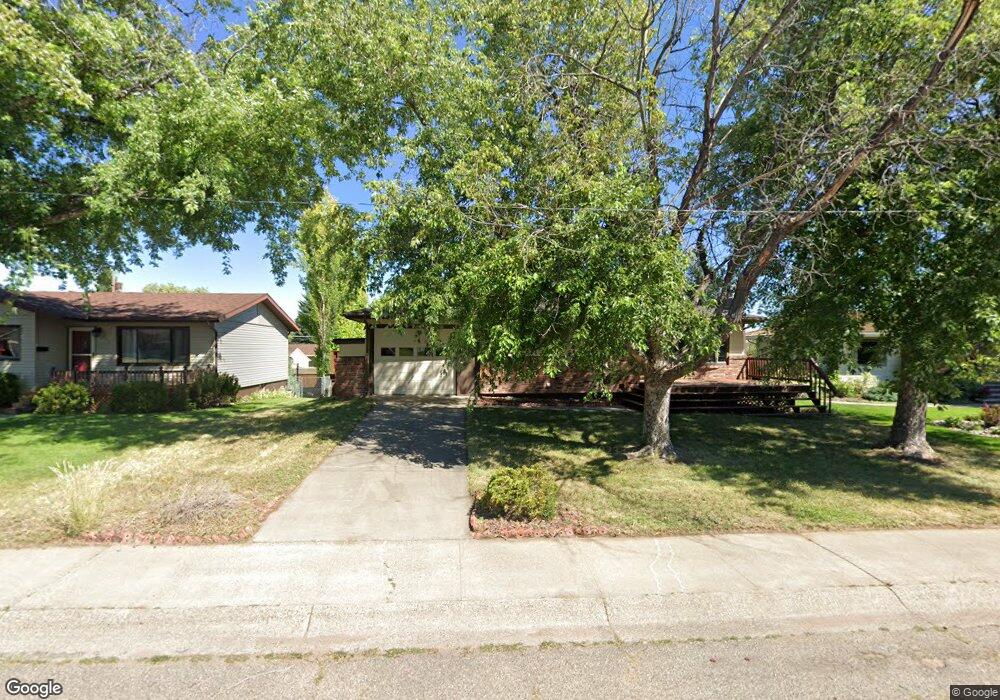
717 52nd St S Great Falls, MT 59405
Estimated Value: $237,000 - $329,656
4
Beds
2
Baths
2,088
Sq Ft
$142/Sq Ft
Est. Value
About This Home
This home is located at 717 52nd St S, Great Falls, MT 59405 and is currently estimated at $297,164, approximately $142 per square foot. 717 52nd St S is a home located in Cascade County with nearby schools including Chief Joseph School, East Middle School, and Great Falls High School.
Ownership History
Date
Name
Owned For
Owner Type
Purchase Details
Closed on
Aug 4, 2025
Sold by
Christensen Coleman K and Christensen Kara L
Bought by
Christensen Mil Properties Llc
Current Estimated Value
Purchase Details
Closed on
Sep 26, 2014
Sold by
Ekert Laura Lee
Bought by
Christensen Coleman T and Christensen Kara L
Home Financials for this Owner
Home Financials are based on the most recent Mortgage that was taken out on this home.
Original Mortgage
$173,910
Interest Rate
4.09%
Mortgage Type
VA
Create a Home Valuation Report for This Property
The Home Valuation Report is an in-depth analysis detailing your home's value as well as a comparison with similar homes in the area
Home Values in the Area
Average Home Value in this Area
Purchase History
| Date | Buyer | Sale Price | Title Company |
|---|---|---|---|
| Christensen Mil Properties Llc | -- | None Listed On Document | |
| Christensen Coleman T | -- | Fatco |
Source: Public Records
Mortgage History
| Date | Status | Borrower | Loan Amount |
|---|---|---|---|
| Previous Owner | Christensen Coleman T | $173,910 |
Source: Public Records
Tax History Compared to Growth
Tax History
| Year | Tax Paid | Tax Assessment Tax Assessment Total Assessment is a certain percentage of the fair market value that is determined by local assessors to be the total taxable value of land and additions on the property. | Land | Improvement |
|---|---|---|---|---|
| 2025 | $1,762 | $333,700 | $0 | $0 |
| 2024 | $2,794 | $270,100 | $0 | $0 |
| 2023 | $2,742 | $270,100 | $0 | $0 |
| 2022 | $2,326 | $204,500 | $0 | $0 |
| 2021 | $2,163 | $204,500 | $0 | $0 |
| 2020 | $2,159 | $183,400 | $0 | $0 |
| 2019 | $2,058 | $183,400 | $0 | $0 |
| 2018 | $2,140 | $188,800 | $0 | $0 |
| 2017 | $1,873 | $173,600 | $0 | $0 |
| 2016 | $1,729 | $169,800 | $0 | $0 |
| 2015 | $1,632 | $169,800 | $0 | $0 |
| 2014 | $1,685 | $85,595 | $0 | $0 |
Source: Public Records
Map
Nearby Homes