Estimated Value: $213,000 - $279,000
--
Bed
--
Bath
2,264
Sq Ft
$108/Sq Ft
Est. Value
About This Home
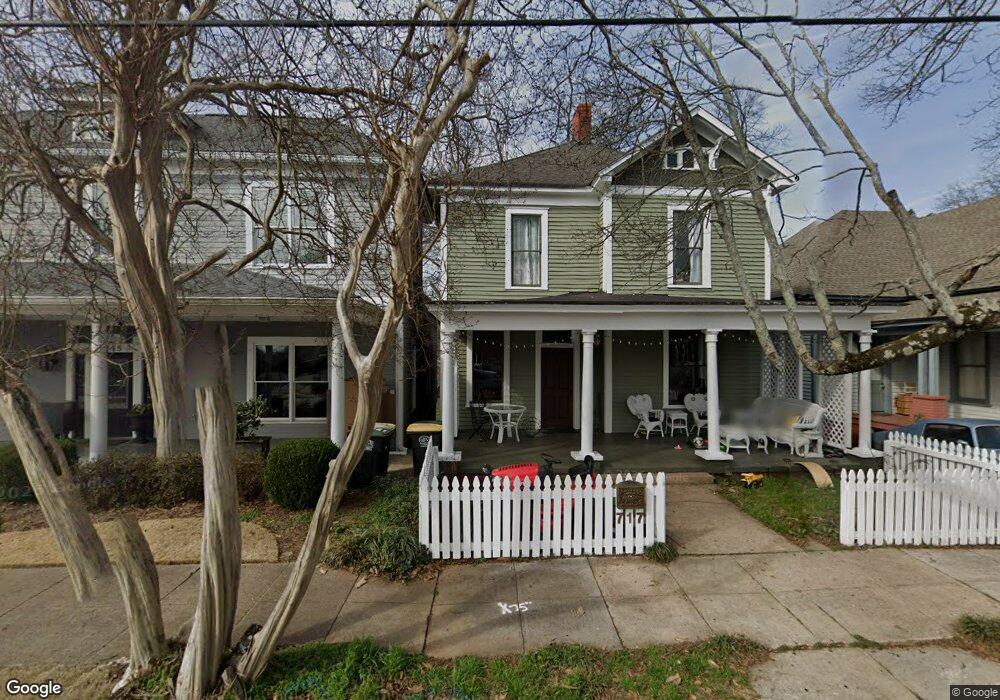
This home is located at 717 Avenue A NE, Rome, GA 30165 and is currently estimated at $244,824, approximately $108 per square foot. 717 Avenue A NE is a home located in Floyd County with nearby schools including Rome High School, St. Mary School, and Darlington School.
Ownership History
Date
Name
Owned For
Owner Type
Purchase Details
Closed on
Sep 9, 2025
Sold by
Ward Michael
Bought by
Em Ward & Sons Llc
Current Estimated Value
Purchase Details
Closed on
Jan 25, 2024
Sold by
Mcburnett Patricia
Bought by
Ward Michael
Home Financials for this Owner
Home Financials are based on the most recent Mortgage that was taken out on this home.
Original Mortgage
$164,500
Interest Rate
6.71%
Mortgage Type
New Conventional
Purchase Details
Closed on
Jun 16, 2023
Sold by
Dake Nena
Bought by
Mcburnett Patricia and Ward Michael
Purchase Details
Closed on
Aug 22, 1996
Sold by
Barron Roy H and Alan Lee Bowen
Bought by
Dake Nena
Purchase Details
Closed on
Dec 30, 1988
Sold by
Mitchell Berta T
Bought by
Barron Roy H and Alan Lee Bowen
Purchase Details
Closed on
Oct 24, 1983
Sold by
Terrell Annie Beth Est
Bought by
Mitchell Berta T
Purchase Details
Closed on
Jan 1, 1901
Bought by
Terrell Annie Beth Est
Create a Home Valuation Report for This Property
The Home Valuation Report is an in-depth analysis detailing your home's value as well as a comparison with similar homes in the area
Home Values in the Area
Average Home Value in this Area
Purchase History
| Date | Buyer | Sale Price | Title Company |
|---|---|---|---|
| Em Ward & Sons Llc | -- | -- | |
| Ward Michael | -- | -- | |
| Mcburnett Patricia | $75,000 | -- | |
| Dake Nena | $25,500 | -- | |
| Barron Roy H | $28,000 | -- | |
| Mitchell Berta T | -- | -- | |
| Terrell Annie Beth Est | -- | -- |
Source: Public Records
Mortgage History
| Date | Status | Borrower | Loan Amount |
|---|---|---|---|
| Previous Owner | Ward Michael | $164,500 |
Source: Public Records
Tax History Compared to Growth
Tax History
| Year | Tax Paid | Tax Assessment Tax Assessment Total Assessment is a certain percentage of the fair market value that is determined by local assessors to be the total taxable value of land and additions on the property. | Land | Improvement |
|---|---|---|---|---|
| 2024 | $3,129 | $80,495 | $7,937 | $72,558 |
| 2023 | $3,153 | $89,791 | $7,174 | $82,617 |
| 2022 | $2,689 | $73,696 | $5,953 | $67,743 |
| 2021 | $2,458 | $66,242 | $5,953 | $60,289 |
| 2020 | $1,924 | $51,417 | $4,579 | $46,838 |
| 2019 | $1,696 | $45,807 | $4,579 | $41,228 |
| 2018 | $1,588 | $42,903 | $4,579 | $38,324 |
| 2017 | $1,475 | $39,837 | $4,579 | $35,258 |
| 2016 | $1,436 | $38,680 | $4,560 | $34,120 |
| 2015 | $1,364 | $38,905 | $4,560 | $34,345 |
| 2014 | $1,364 | $38,905 | $4,560 | $34,345 |
Source: Public Records
Map
Nearby Homes
- 601 W 10th St NE
- 1006 Avenue A NE
- 527 W 11th St NE
- 1005 N 2nd Ave NW Unit 39
- PEARSON Plan at Shorter Village
- 1018 N 2nd Ave NW
- 1 E 3rd Ave Unit 302
- 110 Smith St NE
- 204 E 5th Ave
- 407 E 3rd St
- 202 E 4th Ave Unit 5
- 202 E 4th Ave
- 115 Ross St NE
- 138 E 8th Ave Unit 25
- 15 Heard St
- 13 Heard St NE
- 312 E 3rd St
- 31 Ross St NE
- 106 Ross St NE
- 214 E 3rd St
- 715 Avenue A NE
- 719 Avenue A NE
- 713 Avenue A NE
- 723 Avenue A NE
- 711 Avenue A NE
- 725 Avenue A NE
- 709 Avenue A NE
- 716 Avenue A NE
- 716A Avenue A NE Unit C
- 707 Avenue A NE
- 720 Avenue A NE
- 727 Avenue A NE
- 718 Avenue A NE
- 705 Avenue A NE
- 603 W 9th St NE
- 601 W 9th St NE
- 722 Avenue A NE
- 729 Avenue A NE
- 712 Avenue A NE
- 712 Avenue A Unit 16