Estimated Value: $146,000 - $180,000
4
Beds
2
Baths
1,118
Sq Ft
$146/Sq Ft
Est. Value
About This Home
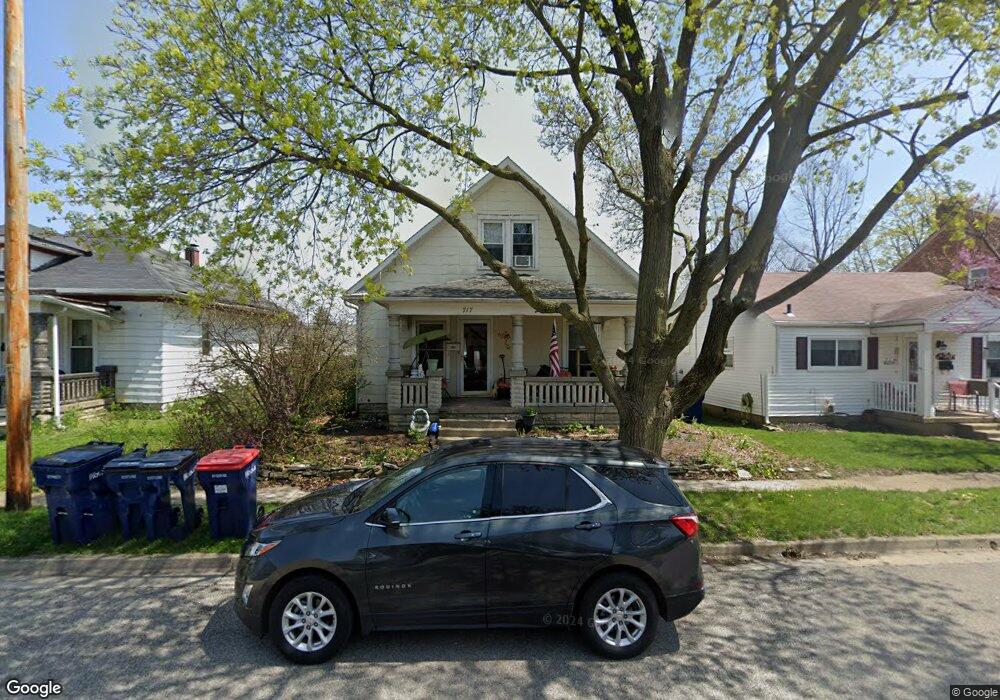
This home is located at 717 Brice Ave, Piqua, OH 45356 and is currently estimated at $163,664, approximately $146 per square foot. 717 Brice Ave is a home located in Miami County with nearby schools including Piqua Junior High School, Piqua High School, and Nicholas School.
Ownership History
Date
Name
Owned For
Owner Type
Purchase Details
Closed on
Sep 8, 2010
Sold by
Penrod Thomas E and Penrod Sue Ann
Bought by
Hampton Alicia M
Current Estimated Value
Home Financials for this Owner
Home Financials are based on the most recent Mortgage that was taken out on this home.
Original Mortgage
$86,830
Outstanding Balance
$57,627
Interest Rate
4.54%
Mortgage Type
FHA
Estimated Equity
$106,037
Purchase Details
Closed on
Dec 2, 2009
Sold by
Wells Fargo Bank National Association
Bought by
Penrod Thomas E and Penrod Sue Ann
Purchase Details
Closed on
Nov 9, 2009
Sold by
Werling Sandra L
Bought by
Wells Fargo Bank National Association
Purchase Details
Closed on
Aug 27, 2001
Sold by
Werling Michael G
Bought by
Werling Sandra L
Purchase Details
Closed on
Mar 12, 1999
Sold by
Werling Donald G and Werling Dona R
Bought by
Werling Michael G and Werling Sandra L
Purchase Details
Closed on
Nov 21, 1994
Sold by
Messer Walter
Bought by
Werling Donald G and Werling Iona R
Create a Home Valuation Report for This Property
The Home Valuation Report is an in-depth analysis detailing your home's value as well as a comparison with similar homes in the area
Home Values in the Area
Average Home Value in this Area
Purchase History
| Date | Buyer | Sale Price | Title Company |
|---|---|---|---|
| Hampton Alicia M | $88,000 | -- | |
| Penrod Thomas E | $31,200 | -- | |
| Wells Fargo Bank National Association | $40,000 | -- | |
| Werling Sandra L | -- | -- | |
| Werling Michael G | -- | -- | |
| Werling Donald G | $56,000 | -- |
Source: Public Records
Mortgage History
| Date | Status | Borrower | Loan Amount |
|---|---|---|---|
| Open | Werling Michael G | $86,830 | |
| Closed | Werling Donald G | -- |
Source: Public Records
Tax History Compared to Growth
Tax History
| Year | Tax Paid | Tax Assessment Tax Assessment Total Assessment is a certain percentage of the fair market value that is determined by local assessors to be the total taxable value of land and additions on the property. | Land | Improvement |
|---|---|---|---|---|
| 2024 | $1,529 | $37,210 | $6,300 | $30,910 |
| 2023 | $1,529 | $37,210 | $6,300 | $30,910 |
| 2022 | $1,556 | $37,210 | $6,300 | $30,910 |
| 2021 | $1,260 | $27,550 | $4,660 | $22,890 |
| 2020 | $1,234 | $27,550 | $4,660 | $22,890 |
| 2019 | $1,241 | $27,550 | $4,660 | $22,890 |
| 2018 | $1,250 | $26,500 | $4,660 | $21,840 |
| 2017 | $1,266 | $26,500 | $4,660 | $21,840 |
| 2016 | $1,252 | $26,500 | $4,660 | $21,840 |
| 2015 | $1,231 | $25,480 | $4,480 | $21,000 |
| 2014 | $1,231 | $25,480 | $4,480 | $21,000 |
| 2013 | $1,236 | $25,480 | $4,480 | $21,000 |
Source: Public Records
Map
Nearby Homes
- 708 Brice Ave
- 605 Boal Ave
- 1005 South St
- 1110 South St
- 730 Gordon St
- 825 Clark Ave
- 807 Brook St
- 801 Manier Ave
- 707 Leonard St
- 635 Clark Ave
- 420 Summit St
- 1207 S Roosevelt Ave
- 416 Garnsey St
- 1505 Amherst Ave
- 624 Adams St
- 1513 Arrowhead Dr
- 1502 Arrowhead Dr
- Ironwood Plan at Arrowhead Estates
- Juniper Plan at Arrowhead Estates
- Spruce Plan at Arrowhead Estates