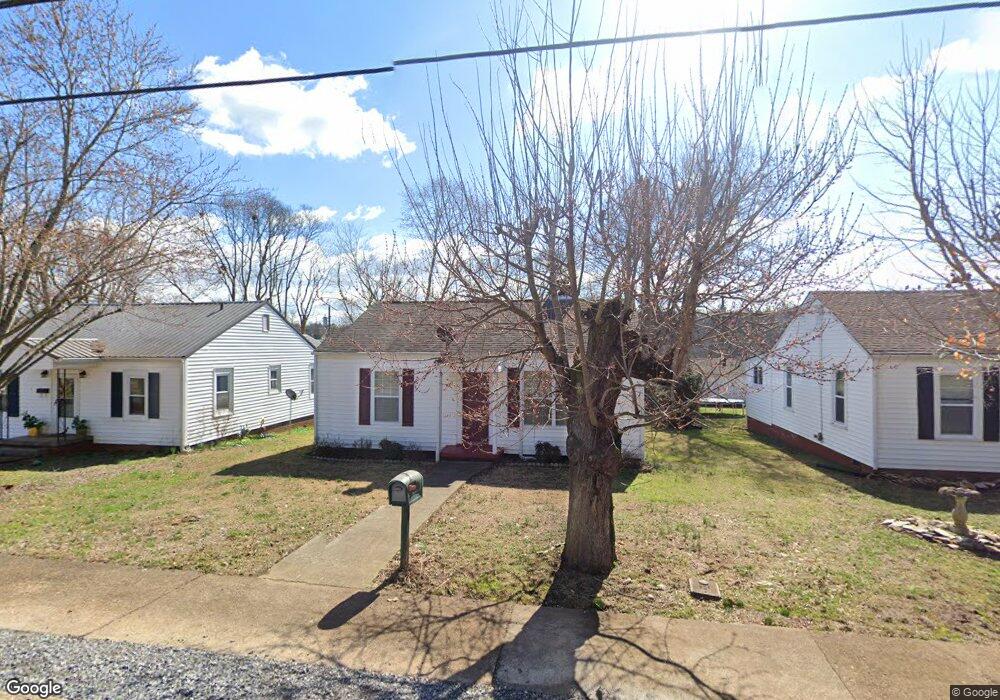
717 Ferry St Loudon, TN 37774
Estimated Value: $131,559 - $185,000
Studio
1
Bath
930
Sq Ft
$160/Sq Ft
Est. Value
About This Home
This home is located at 717 Ferry St, Loudon, TN 37774 and is currently estimated at $148,640, approximately $159 per square foot. 717 Ferry St is a home located in Loudon County with nearby schools including Loudon High School.
Ownership History
Date
Name
Owned For
Owner Type
Purchase Details
Closed on
Dec 21, 2021
Sold by
Caleb Hubbard
Bought by
Runnels Stephen L and Runnels Cynthia J
Current Estimated Value
Home Financials for this Owner
Home Financials are based on the most recent Mortgage that was taken out on this home.
Original Mortgage
$175,750
Outstanding Balance
$161,361
Interest Rate
2.98%
Mortgage Type
New Conventional
Estimated Equity
-$12,721
Purchase Details
Closed on
Jun 16, 2008
Sold by
Mlh Construction Inc
Bought by
Juan Medina
Purchase Details
Closed on
Aug 30, 2001
Bought by
Mlh Construction Inc
Purchase Details
Closed on
Apr 10, 1998
Bought by
Bivens Kenneth Michael and Bivens Leslie
Create a Home Valuation Report for This Property
The Home Valuation Report is an in-depth analysis detailing your home's value as well as a comparison with similar homes in the area
Home Values in the Area
Average Home Value in this Area
Purchase History
| Date | Buyer | Sale Price | Title Company |
|---|---|---|---|
| Runnels Stephen L | $185,000 | Costner & Greene | |
| Juan Medina | $60,000 | -- | |
| Mlh Construction Inc | $42,000 | -- | |
| Bivens Kenneth Michael | $30,000 | -- |
Source: Public Records
Mortgage History
| Date | Status | Borrower | Loan Amount |
|---|---|---|---|
| Open | Runnels Stephen L | $175,750 |
Source: Public Records
Tax History
| Year | Tax Paid | Tax Assessment Tax Assessment Total Assessment is a certain percentage of the fair market value that is determined by local assessors to be the total taxable value of land and additions on the property. | Land | Improvement |
|---|---|---|---|---|
| 2025 | $377 | $21,300 | $3,675 | $17,625 |
| 2024 | $557 | $21,300 | $3,675 | $17,625 |
| 2023 | $557 | $21,300 | $0 | $0 |
| 2022 | $557 | $21,300 | $3,675 | $17,625 |
| 2021 | $557 | $21,300 | $3,675 | $17,625 |
| 2020 | $435 | $21,300 | $3,675 | $17,625 |
| 2019 | $435 | $14,325 | $2,750 | $11,575 |
| 2018 | $427 | $14,325 | $2,750 | $11,575 |
| 2017 | $427 | $14,325 | $2,750 | $11,575 |
| 2016 | $411 | $13,550 | $3,375 | $10,175 |
| 2015 | $411 | $13,550 | $3,375 | $10,175 |
| 2014 | $411 | $13,550 | $3,375 | $10,175 |
Source: Public Records
Map
Nearby Homes
Your Personal Tour Guide
Ask me questions while you tour the home.