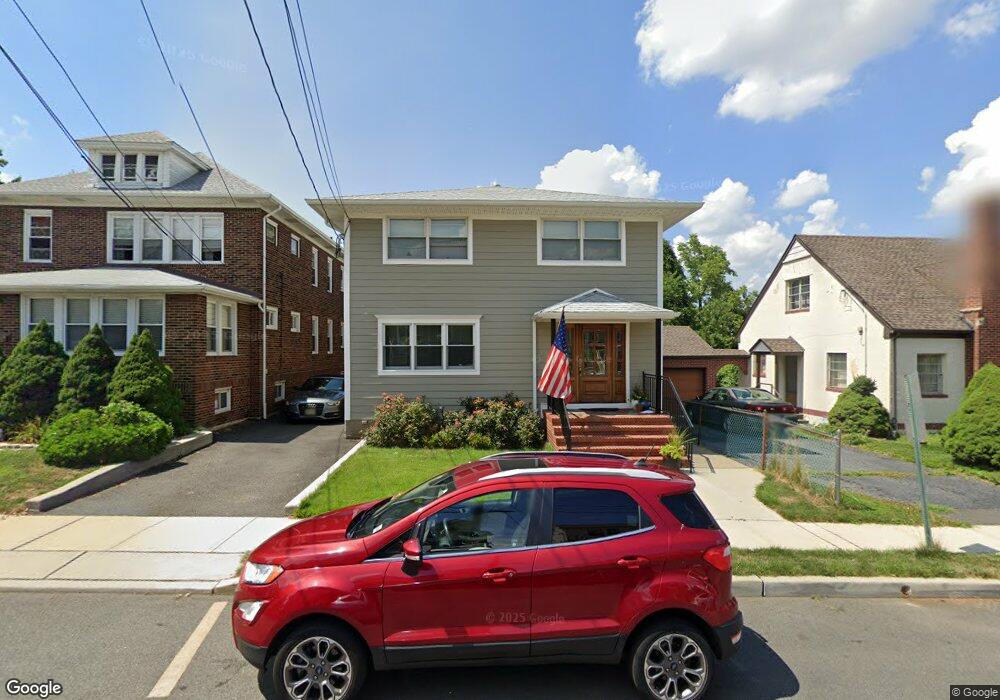
717 John St Secaucus, NJ 07094
Estimated Value: $601,000 - $1,044,000
--
Bed
--
Bath
--
Sq Ft
4,748
Sq Ft Lot
About This Home
This home is located at 717 John St, Secaucus, NJ 07094 and is currently estimated at $826,423. 717 John St is a home located in Hudson County with nearby schools including Secaucus High School.
Ownership History
Date
Name
Owned For
Owner Type
Purchase Details
Closed on
Dec 14, 2021
Sold by
Credit Chelter Trust and Baker Azzam
Bought by
Baker Margaret and Atoot Rami
Current Estimated Value
Purchase Details
Closed on
Nov 4, 2021
Sold by
Baker Zeyad and Baker Iyad
Bought by
Baker Azzam
Purchase Details
Closed on
Mar 20, 2017
Sold by
Lynch Ann Marie
Bought by
Cunningham Seamus and Cunningham Laurie
Home Financials for this Owner
Home Financials are based on the most recent Mortgage that was taken out on this home.
Original Mortgage
$360,000
Interest Rate
4.1%
Mortgage Type
New Conventional
Create a Home Valuation Report for This Property
The Home Valuation Report is an in-depth analysis detailing your home's value as well as a comparison with similar homes in the area
Home Values in the Area
Average Home Value in this Area
Purchase History
| Date | Buyer | Sale Price | Title Company |
|---|---|---|---|
| Baker Margaret | -- | None Listed On Document | |
| Baker Azzam | -- | None Listed On Document | |
| Cunningham Seamus | $450,000 | Grandview Title Agency |
Source: Public Records
Mortgage History
| Date | Status | Borrower | Loan Amount |
|---|---|---|---|
| Previous Owner | Cunningham Seamus | $360,000 |
Source: Public Records
Tax History Compared to Growth
Tax History
| Year | Tax Paid | Tax Assessment Tax Assessment Total Assessment is a certain percentage of the fair market value that is determined by local assessors to be the total taxable value of land and additions on the property. | Land | Improvement |
|---|---|---|---|---|
| 2025 | $9,723 | $237,600 | $79,600 | $158,000 |
| 2024 | $9,129 | $237,600 | $79,600 | $158,000 |
| 2023 | $9,129 | $230,000 | $0 | $0 |
| 2022 | $8,655 | $230,000 | $0 | $0 |
| 2021 | $8,671 | $230,000 | $0 | $0 |
| 2020 | $8,593 | $230,000 | $0 | $0 |
| 2019 | $8,538 | $237,600 | $79,600 | $158,000 |
| 2018 | $8,303 | $230,000 | $79,600 | $150,400 |
| 2017 | $8,312 | $230,000 | $79,600 | $150,400 |
| 2016 | $8,526 | $230,000 | $79,600 | $150,400 |
| 2015 | $8,265 | $230,000 | $79,600 | $150,400 |
| 2014 | $8,412 | $230,000 | $79,600 | $150,400 |
Source: Public Records
Map
Nearby Homes