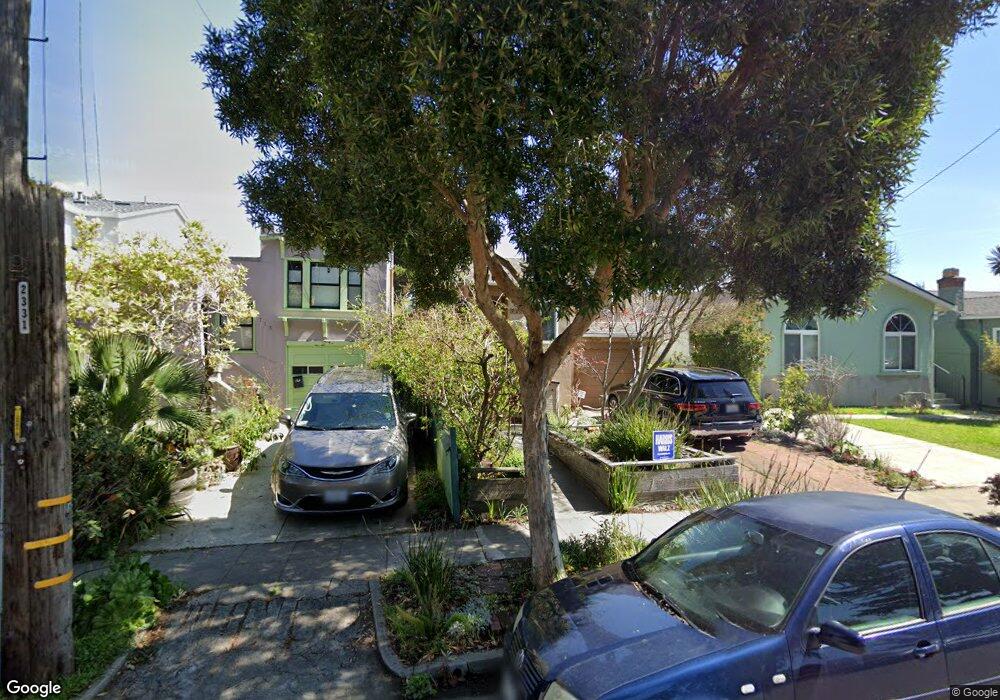
717 Key Route Blvd Albany, CA 94706
Thousand Oaks NeighborhoodEstimated Value: $1,359,000 - $1,550,000
3
Beds
2
Baths
1,556
Sq Ft
$949/Sq Ft
Est. Value
About This Home
This home is located at 717 Key Route Blvd, Albany, CA 94706 and is currently estimated at $1,476,868, approximately $949 per square foot. 717 Key Route Blvd is a home located in Alameda County with nearby schools including Albany Middle School, Albany High School, and Tehiyah Day School.
Ownership History
Date
Name
Owned For
Owner Type
Purchase Details
Closed on
Sep 26, 2016
Sold by
Malik Asif
Bought by
Ambrosio Paul Eric and Corsilles Michelle E
Current Estimated Value
Home Financials for this Owner
Home Financials are based on the most recent Mortgage that was taken out on this home.
Original Mortgage
$792,000
Outstanding Balance
$634,332
Interest Rate
3.43%
Mortgage Type
New Conventional
Estimated Equity
$842,536
Purchase Details
Closed on
Apr 19, 2016
Sold by
Malik Christina
Bought by
Malik Asif
Purchase Details
Closed on
Apr 15, 2016
Sold by
Fleming Vincent N and Fleming Van Dalsem
Bought by
Malik Asif
Purchase Details
Closed on
May 14, 1996
Sold by
Harlan Teresa A and Woolis Rebecca
Bought by
Fleming Vincent N and Vandalsem Anne M
Home Financials for this Owner
Home Financials are based on the most recent Mortgage that was taken out on this home.
Original Mortgage
$207,000
Interest Rate
8.07%
Mortgage Type
Balloon
Create a Home Valuation Report for This Property
The Home Valuation Report is an in-depth analysis detailing your home's value as well as a comparison with similar homes in the area
Home Values in the Area
Average Home Value in this Area
Purchase History
| Date | Buyer | Sale Price | Title Company |
|---|---|---|---|
| Ambrosio Paul Eric | $990,000 | Chicago Title Company | |
| Malik Asif | -- | North American Title Co Inc | |
| Malik Asif | $700,000 | North American Title Co Inc | |
| Fleming Vincent N | $279,500 | Placer Title Company |
Source: Public Records
Mortgage History
| Date | Status | Borrower | Loan Amount |
|---|---|---|---|
| Open | Ambrosio Paul Eric | $792,000 | |
| Previous Owner | Fleming Vincent N | $207,000 | |
| Closed | Fleming Vincent N | $44,550 |
Source: Public Records
Tax History
| Year | Tax Paid | Tax Assessment Tax Assessment Total Assessment is a certain percentage of the fair market value that is determined by local assessors to be the total taxable value of land and additions on the property. | Land | Improvement |
|---|---|---|---|---|
| 2025 | $18,554 | $1,141,954 | $344,686 | $804,268 |
| 2024 | $18,554 | $1,119,431 | $337,929 | $788,502 |
| 2023 | $17,927 | $1,104,344 | $331,303 | $773,041 |
| 2022 | $17,425 | $1,077,093 | $324,808 | $757,885 |
| 2021 | $17,205 | $1,061,467 | $318,440 | $743,027 |
| 2020 | $17,082 | $1,050,587 | $315,176 | $735,411 |
| 2019 | $16,711 | $1,029,995 | $308,998 | $720,997 |
| 2018 | $16,236 | $1,009,800 | $302,940 | $706,860 |
| 2017 | $15,839 | $990,000 | $297,000 | $693,000 |
| 2016 | $7,278 | $392,219 | $117,736 | $274,483 |
| 2015 | $6,842 | $386,330 | $115,968 | $270,362 |
| 2014 | $6,734 | $378,764 | $113,697 | $265,067 |
Source: Public Records
Map
Nearby Homes
- 1259 Portland Ave
- 1266 Washington Ave
- 1236 Portland Ave
- 840 Key Route Blvd
- 731 Santa fe Ave
- 417 Evelyn Ave Unit 205
- 753 Peralta Ave
- 145 Ramona Ave
- 605 San Pablo Ave
- 415 Berkeley Park Blvd
- 946 Kains Ave
- 846 Adams St
- 918 Adams St
- 305 Coronado St
- 986 Kains Ave
- 1498 Sonoma Ave
- 1136 Marin Ave
- 1036 Ramona Ave
- 904 Solano Ave
- 785 Taft Ave Unit 10
- 715 Key Route Blvd
- 719 Key Route Blvd
- 713 Key Route Blvd
- 721 Key Route Blvd
- 711 Key Route Blvd
- 723 Key Route Blvd
- 720 Pomona Ave
- 718 Pomona Ave
- 722 Pomona Ave
- 709 Key Route Blvd
- 716 Pomona Ave
- 724 Pomona Ave
- 725 Key Route Blvd
- 714 Pomona Ave
- 726 Pomona Ave
- 707 Key Route Blvd
- 727 Key Route Blvd
- 712 Pomona Ave
- 730 Pomona Ave
- 710 Pomona Ave
Your Personal Tour Guide
Ask me questions while you tour the home.