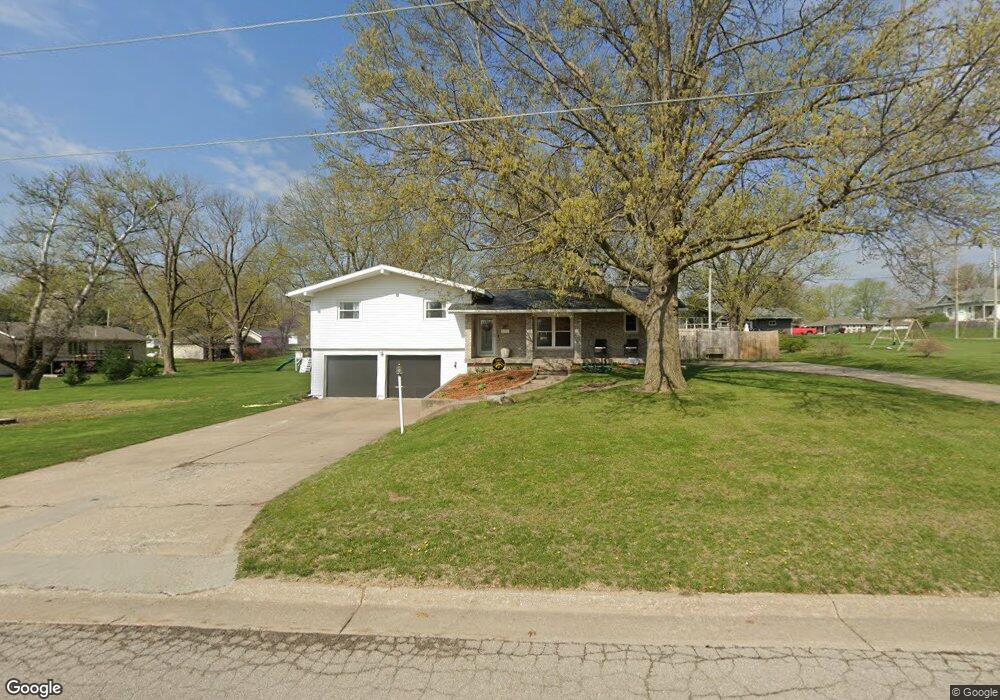
717 N 5th St Chariton, IA 50049
Estimated Value: $267,000 - $430,000
--
Bed
--
Bath
1,660
Sq Ft
$195/Sq Ft
Est. Value
About This Home
This home is located at 717 N 5th St, Chariton, IA 50049 and is currently estimated at $324,054, approximately $195 per square foot. 717 N 5th St is a home located in Lucas County with nearby schools including Van Allen Elementary School, Columbus Elementary School, and Chariton Middle School.
Ownership History
Date
Name
Owned For
Owner Type
Purchase Details
Closed on
Jul 25, 2013
Sold by
State Farm Bank F S B
Bought by
Fedeal National Mortgage Assn
Current Estimated Value
Purchase Details
Closed on
Jul 16, 2013
Sold by
State Farm Bank Fsb
Bought by
Federal National Mortgage Association
Purchase Details
Closed on
Nov 6, 2012
Sold by
Bank Of America Na
Bought by
Federal National Mortgage Association
Create a Home Valuation Report for This Property
The Home Valuation Report is an in-depth analysis detailing your home's value as well as a comparison with similar homes in the area
Home Values in the Area
Average Home Value in this Area
Purchase History
| Date | Buyer | Sale Price | Title Company |
|---|---|---|---|
| Fedeal National Mortgage Assn | -- | None Available | |
| Federal National Mortgage Association | -- | None Available | |
| Federal National Mortgage Association | -- | None Available |
Source: Public Records
Tax History Compared to Growth
Tax History
| Year | Tax Paid | Tax Assessment Tax Assessment Total Assessment is a certain percentage of the fair market value that is determined by local assessors to be the total taxable value of land and additions on the property. | Land | Improvement |
|---|---|---|---|---|
| 2024 | $4,788 | $220,233 | $40,704 | $179,529 |
| 2023 | $4,310 | $220,233 | $40,704 | $179,529 |
| 2022 | $3,714 | $168,099 | $21,200 | $146,899 |
| 2021 | $2,180 | $168,099 | $21,200 | $146,899 |
| 2020 | $2,180 | $98,167 | $17,666 | $80,501 |
| 2019 | $1,998 | $178,668 | $98,167 | $80,501 |
| 2018 | $1,974 | $85,363 | $15,362 | $70,001 |
| 2017 | $1,974 | $80,531 | $0 | $0 |
| 2016 | $1,902 | $80,531 | $0 | $0 |
| 2015 | $1,902 | $80,531 | $0 | $0 |
| 2014 | $1,898 | $101,026 | $0 | $0 |
Source: Public Records
Map
Nearby Homes