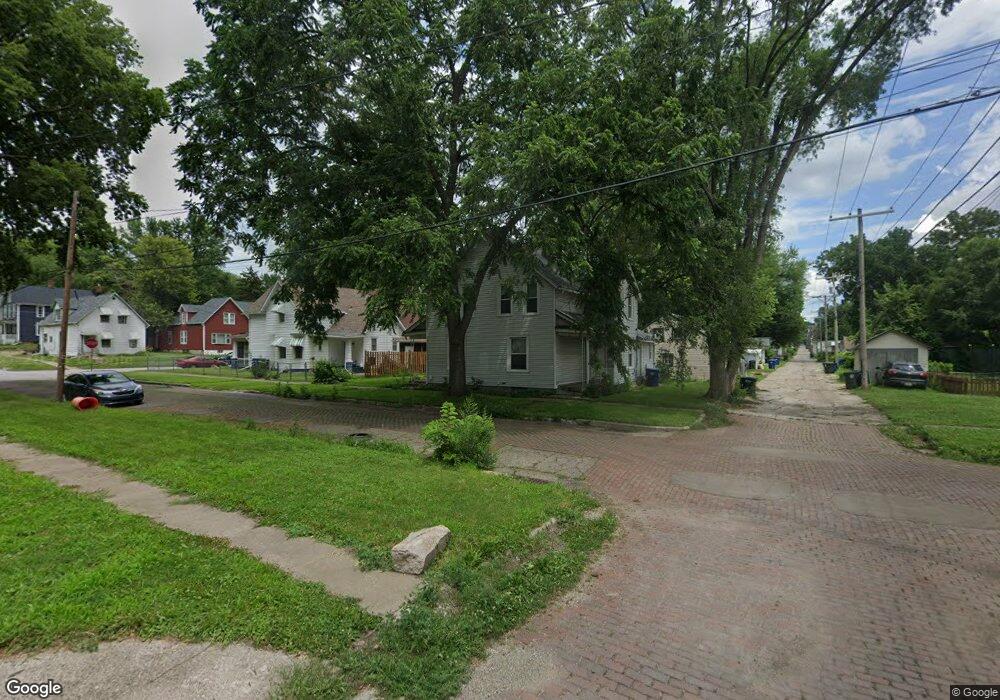
717 N Sturdevant St Unit 719 Davenport, IA 52802
Riverview Terrace NeighborhoodEstimated Value: $78,000 - $109,219
4
Beds
2
Baths
2,700
Sq Ft
$34/Sq Ft
Est. Value
About This Home
This home is located at 717 N Sturdevant St Unit 719, Davenport, IA 52802 and is currently estimated at $92,305, approximately $34 per square foot. 717 N Sturdevant St Unit 719 is a home located in Scott County with nearby schools including Frank L. Smart Intermediate School, West High School, and All Saints Catholic School.
Ownership History
Date
Name
Owned For
Owner Type
Purchase Details
Closed on
Feb 26, 2010
Sold by
White Brian T
Bought by
Murrell Mark A
Current Estimated Value
Home Financials for this Owner
Home Financials are based on the most recent Mortgage that was taken out on this home.
Original Mortgage
$82,282
Outstanding Balance
$54,674
Interest Rate
5.11%
Mortgage Type
FHA
Estimated Equity
$37,631
Purchase Details
Closed on
Jun 9, 2009
Sold by
Northwest Bank & Trust
Bought by
White Brian T
Home Financials for this Owner
Home Financials are based on the most recent Mortgage that was taken out on this home.
Original Mortgage
$53,200
Interest Rate
4.92%
Mortgage Type
Future Advance Clause Open End Mortgage
Purchase Details
Closed on
Apr 6, 2007
Sold by
Freeborn Thomas B and Freeborn Jody L
Bought by
Northwest Bank & Trust Co
Create a Home Valuation Report for This Property
The Home Valuation Report is an in-depth analysis detailing your home's value as well as a comparison with similar homes in the area
Home Values in the Area
Average Home Value in this Area
Purchase History
| Date | Buyer | Sale Price | Title Company |
|---|---|---|---|
| Murrell Mark A | $84,000 | None Available | |
| White Brian T | $33,500 | None Available | |
| Northwest Bank & Trust Co | -- | None Available |
Source: Public Records
Mortgage History
| Date | Status | Borrower | Loan Amount |
|---|---|---|---|
| Open | Murrell Mark A | $82,282 | |
| Previous Owner | White Brian T | $53,200 |
Source: Public Records
Tax History Compared to Growth
Tax History
| Year | Tax Paid | Tax Assessment Tax Assessment Total Assessment is a certain percentage of the fair market value that is determined by local assessors to be the total taxable value of land and additions on the property. | Land | Improvement |
|---|---|---|---|---|
| 2025 | $1,162 | $84,210 | $7,880 | $76,330 |
| 2024 | $1,130 | $75,230 | $7,880 | $67,350 |
| 2023 | $1,038 | $75,230 | $7,880 | $67,350 |
| 2022 | $1,040 | $57,460 | $7,880 | $49,580 |
| 2021 | $1,040 | $57,460 | $7,880 | $49,580 |
| 2020 | $934 | $51,780 | $7,880 | $43,900 |
| 2019 | $970 | $51,780 | $7,880 | $43,900 |
| 2018 | $946 | $51,780 | $7,880 | $43,900 |
| 2017 | $288 | $51,780 | $7,880 | $43,900 |
| 2016 | $1,397 | $51,780 | $0 | $0 |
| 2015 | $944 | $53,680 | $0 | $0 |
| 2014 | $998 | $54,560 | $0 | $0 |
| 2013 | $996 | $0 | $0 | $0 |
| 2012 | -- | $64,280 | $5,120 | $59,160 |
Source: Public Records
Map
Nearby Homes
- 717 & 719 Sturdevant
- 717 N Sturdevant St
- 717 N Sturdevant St Unit 19
- 717 N Sturdevant St
- 1525 W 8th St
- 1527 W 8th St
- 1523 W 8th St
- 1603 W 8th St
- 1521 W 8th St
- 1521 W 8th St Unit 23
- 1530 W 7th St
- 1524 W 7th St
- 1517 W 8th St
- 1607 W 8th St
- 1522 W 7th St
- 1511 W 8th St
- 1516 W 7th St
- 1611 W 8th St
- 1608 W 7th St
- 1530 W 8th St