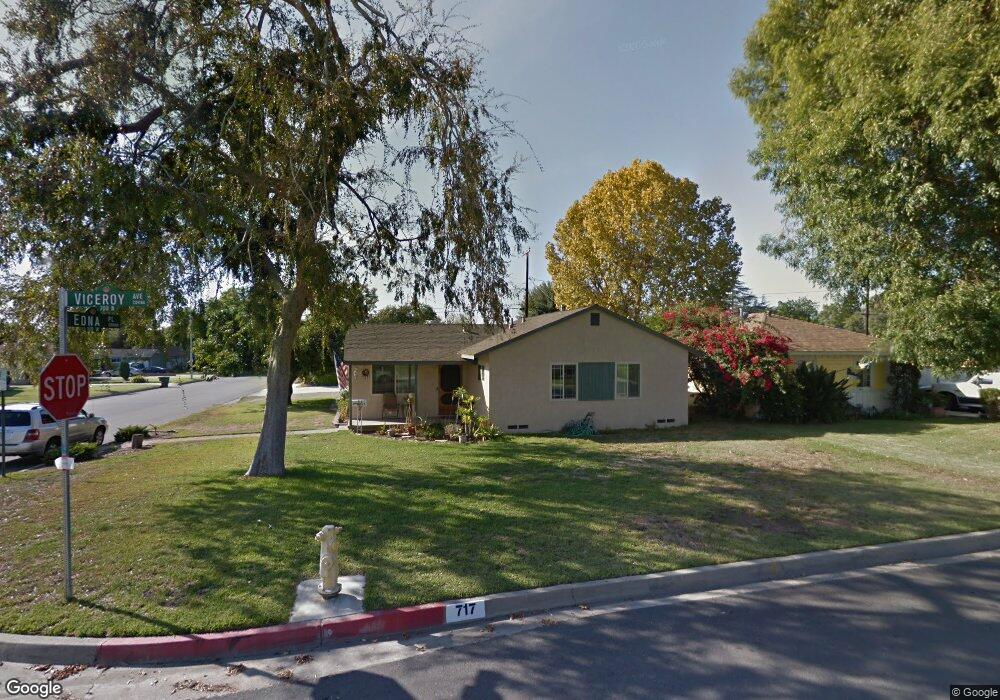
717 N Viceroy Ave Covina, CA 91723
Estimated Value: $615,403 - $743,000
3
Beds
1
Bath
980
Sq Ft
$713/Sq Ft
Est. Value
About This Home
This home is located at 717 N Viceroy Ave, Covina, CA 91723 and is currently estimated at $698,601, approximately $712 per square foot. 717 N Viceroy Ave is a home located in Los Angeles County with nearby schools including Cypress Elementary School, Las Palmas Middle School, and Northview High School.
Ownership History
Date
Name
Owned For
Owner Type
Purchase Details
Closed on
Oct 27, 2020
Sold by
Ledesma Gilbert and Ledesma Yolanda V
Bought by
Gilbert Ledesma And Yolanda V Ledesma Revocab and Ledesma
Current Estimated Value
Purchase Details
Closed on
Oct 23, 2002
Sold by
Ledesma Yolanda V and Velazquez Yolanda
Bought by
Ledesma Gilbert and Ledesma Yolanda V
Home Financials for this Owner
Home Financials are based on the most recent Mortgage that was taken out on this home.
Original Mortgage
$110,000
Interest Rate
6.12%
Purchase Details
Closed on
Feb 23, 1994
Sold by
Gordon Richard Vernon and Gordon Norma Jeane
Bought by
Velazquez Yolanda and Velazquez Carlos Gonzalez
Home Financials for this Owner
Home Financials are based on the most recent Mortgage that was taken out on this home.
Original Mortgage
$108,000
Interest Rate
7.15%
Create a Home Valuation Report for This Property
The Home Valuation Report is an in-depth analysis detailing your home's value as well as a comparison with similar homes in the area
Home Values in the Area
Average Home Value in this Area
Purchase History
| Date | Buyer | Sale Price | Title Company |
|---|---|---|---|
| Gilbert Ledesma And Yolanda V Ledesma Revocab | -- | None Listed On Document | |
| Ledesma Gilbert | -- | Southland Title Corporation | |
| Velazquez Yolanda | $135,000 | Pacific Title Guaranty Compa |
Source: Public Records
Mortgage History
| Date | Status | Borrower | Loan Amount |
|---|---|---|---|
| Previous Owner | Ledesma Gilbert | $110,000 | |
| Previous Owner | Velazquez Yolanda | $108,000 |
Source: Public Records
Tax History Compared to Growth
Tax History
| Year | Tax Paid | Tax Assessment Tax Assessment Total Assessment is a certain percentage of the fair market value that is determined by local assessors to be the total taxable value of land and additions on the property. | Land | Improvement |
|---|---|---|---|---|
| 2025 | $3,639 | $274,009 | $166,954 | $107,055 |
| 2024 | $3,639 | $268,637 | $163,681 | $104,956 |
| 2023 | $3,586 | $263,371 | $160,472 | $102,899 |
| 2022 | $3,539 | $258,208 | $157,326 | $100,882 |
| 2021 | $3,487 | $253,146 | $154,242 | $98,904 |
| 2020 | $3,443 | $250,551 | $152,661 | $97,890 |
| 2019 | $3,411 | $245,639 | $149,668 | $95,971 |
| 2018 | $3,235 | $240,824 | $146,734 | $94,090 |
| 2016 | $3,062 | $231,475 | $141,037 | $90,438 |
| 2015 | $2,976 | $227,999 | $138,919 | $89,080 |
| 2014 | $2,939 | $223,534 | $136,198 | $87,336 |
Source: Public Records
Map
Nearby Homes
- 554 N Cabernet Dr
- 216 W Merlot Dr Unit 58
- 265 W Pershing Ct
- 26 E Cypress St Unit 26
- 247 E Hurst St
- 540 N Howard Ave
- 1025 Star Ruby Dr
- 4709 N Calvados Ave
- 4692 N Edenfield Ave
- 18308 E Brookport St
- 344 E Reed St
- 17924 E Kelby St
- 658 Calamansi Dr
- 664 Calamansi Dr
- 656 Calamansi Dr
- 662 Calamansi Dr
- 652 Calamansi Dr
- 653 Calamansi Dr
- 1143 Orchard Dr
- 251 E Center St
- 725 N Viceroy Ave
- 716 N Edenfield Ave
- 733 N Viceroy Ave
- 724 N Edenfield Ave
- 144 W Edna Place
- 136 W Edna Place
- 716 N Viceroy Ave
- 732 N Edenfield Ave
- 724 N Viceroy Ave
- 154 W Edna Place
- 741 N Viceroy Ave
- 128 W Edna Place
- 732 N Viceroy Ave
- 740 N Edenfield Ave
- 162 W Edna Place
- 120 W Edna Place
- 740 N Viceroy Ave
- 749 N Viceroy Ave
- 717 N Citrus Ave
- 717 N Edenfield Ave