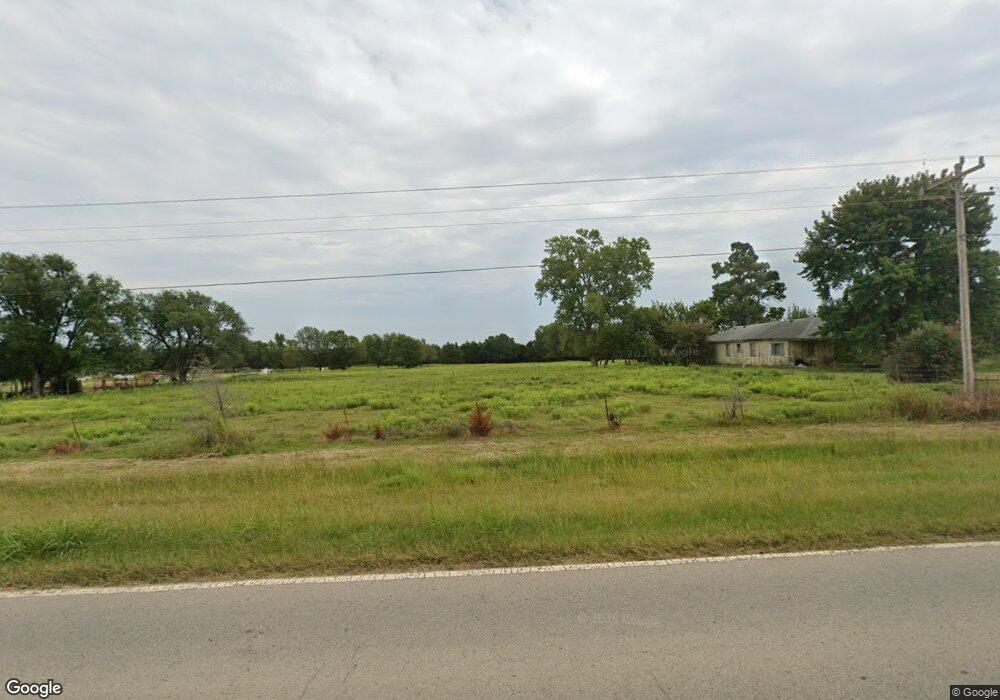
717 S Agra Rd Cushing, OK 74023
Estimated Value: $104,866 - $219,000
3
Beds
1
Bath
1,320
Sq Ft
$135/Sq Ft
Est. Value
About This Home
This home is located at 717 S Agra Rd, Cushing, OK 74023 and is currently estimated at $178,467, approximately $135 per square foot. 717 S Agra Rd is a home located in Payne County with nearby schools including Ripley Elementary School and Ripley High School.
Ownership History
Date
Name
Owned For
Owner Type
Purchase Details
Closed on
Feb 15, 2013
Sold by
Leader Rickey Lee and Leader Sue Lynn
Bought by
Hatfield Teressa and Hatfield Clinton
Current Estimated Value
Home Financials for this Owner
Home Financials are based on the most recent Mortgage that was taken out on this home.
Original Mortgage
$12,750
Interest Rate
3.44%
Mortgage Type
Purchase Money Mortgage
Purchase Details
Closed on
Apr 10, 2009
Sold by
Jones Linda N and Jones Johnny
Bought by
Leader Rickey Lee and Leader Sue Lynn
Create a Home Valuation Report for This Property
The Home Valuation Report is an in-depth analysis detailing your home's value as well as a comparison with similar homes in the area
Home Values in the Area
Average Home Value in this Area
Purchase History
| Date | Buyer | Sale Price | Title Company |
|---|---|---|---|
| Hatfield Teressa | -- | None Available | |
| Leader Rickey Lee | -- | -- |
Source: Public Records
Mortgage History
| Date | Status | Borrower | Loan Amount |
|---|---|---|---|
| Closed | Hatfield Teressa | $12,750 |
Source: Public Records
Tax History Compared to Growth
Tax History
| Year | Tax Paid | Tax Assessment Tax Assessment Total Assessment is a certain percentage of the fair market value that is determined by local assessors to be the total taxable value of land and additions on the property. | Land | Improvement |
|---|---|---|---|---|
| 2024 | $434 | $4,172 | $2,015 | $2,157 |
| 2023 | $434 | $3,524 | $1,850 | $1,674 |
| 2022 | $331 | $3,356 | $1,823 | $1,533 |
| 2021 | $304 | $3,196 | $1,807 | $1,389 |
| 2020 | $292 | $3,044 | $1,745 | $1,299 |
| 2019 | $276 | $2,900 | $1,681 | $1,219 |
| 2018 | $264 | $2,762 | $1,601 | $1,161 |
| 2017 | $258 | $2,630 | $972 | $1,658 |
| 2016 | $248 | $2,505 | $881 | $1,624 |
| 2015 | $218 | $2,386 | $794 | $1,592 |
| 2014 | -- | $2,272 | $706 | $1,566 |
Source: Public Records
Map
Nearby Homes