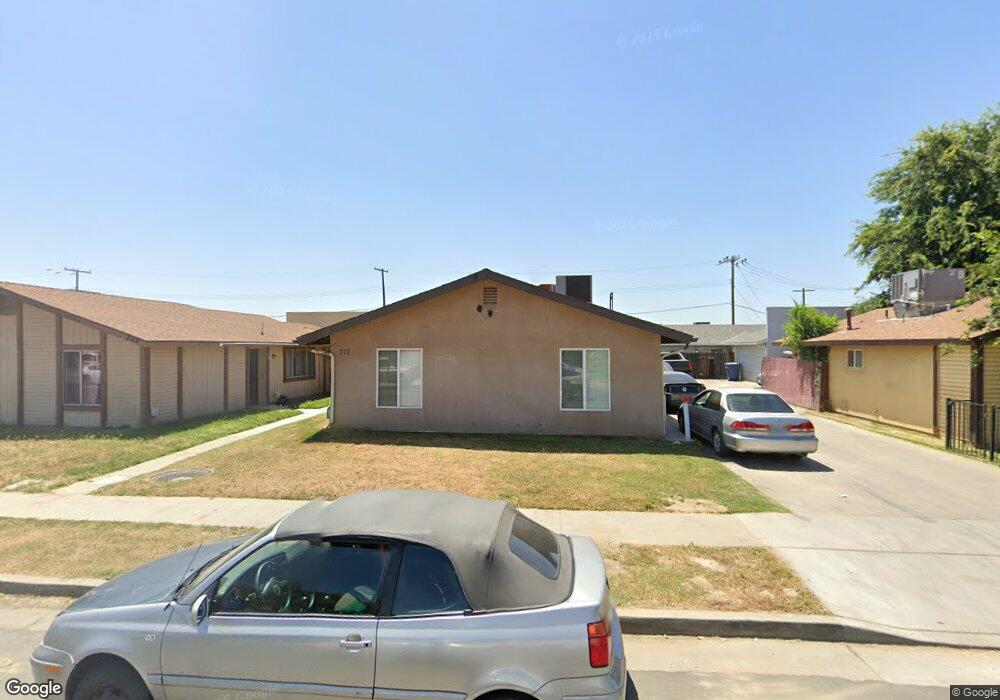
717 S Spruce St Tulare, CA 93274
Tulare Southeast NeighborhoodEstimated Value: $194,000 - $228,000
2
Beds
1
Bath
924
Sq Ft
$225/Sq Ft
Est. Value
About This Home
This home is located at 717 S Spruce St, Tulare, CA 93274 and is currently estimated at $208,258, approximately $225 per square foot. 717 S Spruce St is a home located in Tulare County with nearby schools including Frank Kohn Elementary School, Live Oak Middle School, and Tulare Union High School.
Ownership History
Date
Name
Owned For
Owner Type
Purchase Details
Closed on
Feb 16, 2009
Sold by
Hsbc Bank Usa National Association
Bought by
Noronha Steve and Noronha Shannen L
Current Estimated Value
Purchase Details
Closed on
Jul 1, 2008
Sold by
Estrada Carlos H
Bought by
Hsbc Bank Usa Na and Nomura Asset Acceptance Corp Mortgage Pa
Purchase Details
Closed on
Jan 19, 2006
Sold by
Estrada Pastora
Bought by
Estrada Carlos
Home Financials for this Owner
Home Financials are based on the most recent Mortgage that was taken out on this home.
Original Mortgage
$108,000
Interest Rate
6.16%
Mortgage Type
Fannie Mae Freddie Mac
Purchase Details
Closed on
Nov 30, 1999
Sold by
Hud
Bought by
Dierkes Bruce Eugene and Dierkes Laverna Winette
Purchase Details
Closed on
Aug 24, 1999
Sold by
Chase Mtg Company
Bought by
Hud
Create a Home Valuation Report for This Property
The Home Valuation Report is an in-depth analysis detailing your home's value as well as a comparison with similar homes in the area
Home Values in the Area
Average Home Value in this Area
Purchase History
| Date | Buyer | Sale Price | Title Company |
|---|---|---|---|
| Noronha Steve | $45,000 | North American Title | |
| Hsbc Bank Usa Na | $113,575 | North American Title Co | |
| Estrada Carlos | -- | Chicago Title Co | |
| Estrada Carlos | $135,000 | Chicago Title Co | |
| Dierkes Bruce Eugene | $31,600 | Cuesta Title Company | |
| Hud | -- | Fidelity Title | |
| Chase Mtg Company | $45,869 | Fidelity National Title Ins |
Source: Public Records
Mortgage History
| Date | Status | Borrower | Loan Amount |
|---|---|---|---|
| Previous Owner | Estrada Carlos | $108,000 |
Source: Public Records
Tax History Compared to Growth
Tax History
| Year | Tax Paid | Tax Assessment Tax Assessment Total Assessment is a certain percentage of the fair market value that is determined by local assessors to be the total taxable value of land and additions on the property. | Land | Improvement |
|---|---|---|---|---|
| 2025 | $631 | $57,951 | $32,195 | $25,756 |
| 2024 | $631 | $56,815 | $31,564 | $25,251 |
| 2023 | $615 | $55,702 | $30,946 | $24,756 |
| 2022 | $597 | $54,611 | $30,340 | $24,271 |
| 2021 | $589 | $53,540 | $29,745 | $23,795 |
| 2020 | $599 | $52,991 | $29,440 | $23,551 |
| 2019 | $614 | $51,952 | $28,863 | $23,089 |
| 2018 | $604 | $50,933 | $28,297 | $22,636 |
| 2017 | $599 | $49,934 | $27,742 | $22,192 |
| 2016 | $572 | $48,955 | $27,198 | $21,757 |
| 2015 | $553 | $48,219 | $26,789 | $21,430 |
| 2014 | $553 | $47,274 | $26,264 | $21,010 |
Source: Public Records
Map
Nearby Homes
- 1533 E Birch Ave
- 900 S Ann St
- 501 S Magnolia St
- 980 S Spruce St
- 1065 E Cedar Ave
- 1533 Etna Dr
- 752 S T St
- 716 S Kazarian St
- 860 S Kazarian St
- 1576 E Kern Ave
- 1572 Jasmine Ct
- 629 S R St
- 434 Fallbrook Ct
- 751 S R St
- 931 S Amber St
- 149 S Salida Place
- 813 E Inyo Ave
- 3044 Isleworth Ave Unit 538 Sft
- 861 E Sycamore Ave
- 1625 S Lydia Dr
- 729 S Spruce St
- 721 S Spruce St
- 713 S Spruce St
- 709 S Spruce St
- 733 S Spruce St
- 701 W Alpine Ave
- 705 S Spruce St
- 737 S Spruce St
- 745 S Spruce St
- 1401 E Alpine Ave
- 720 S Spruce St
- 741 S Spruce St
- 728 S Spruce St
- 749 S Spruce St
- 753 S Spruce St
- 736 S Spruce St
- 761 S Spruce St
- 748 S Spruce St
- 757 S Spruce St
- 694 S Spruce St