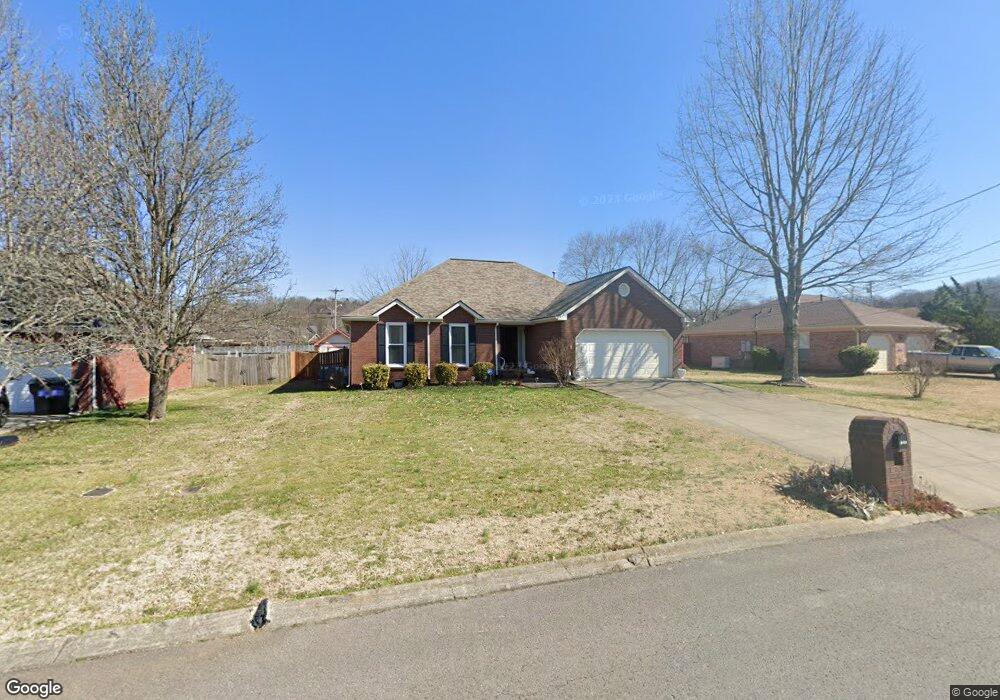
717 Saint Francis Ave Smyrna, TN 37167
Estimated Value: $360,606 - $411,000
--
Bed
3
Baths
1,517
Sq Ft
$257/Sq Ft
Est. Value
About This Home
This home is located at 717 Saint Francis Ave, Smyrna, TN 37167 and is currently estimated at $389,152, approximately $256 per square foot. 717 Saint Francis Ave is a home located in Rutherford County with nearby schools including Rocky Fork Elementary School, Rocky Fork Middle School, and Smyrna High School.
Ownership History
Date
Name
Owned For
Owner Type
Purchase Details
Closed on
Jun 30, 2006
Sold by
Curtis Sloan Matthew
Bought by
Mcbride Nancy J
Current Estimated Value
Purchase Details
Closed on
May 11, 2006
Sold by
And Mclaughlin Paul
Bought by
Curtis Sloan Matthew
Purchase Details
Closed on
Jun 26, 2003
Sold by
Landun Jody K
Bought by
Paul Mclaughlin
Home Financials for this Owner
Home Financials are based on the most recent Mortgage that was taken out on this home.
Original Mortgage
$141,000
Interest Rate
5.68%
Purchase Details
Closed on
Apr 4, 1995
Sold by
Corley Donald R
Bought by
Landrum Jody K
Purchase Details
Closed on
Nov 17, 1994
Sold by
Rock Springs Partners
Bought by
Intorcia John L
Purchase Details
Closed on
Oct 4, 1994
Sold by
Rock Springs Partners
Bought by
Corley Donald R
Create a Home Valuation Report for This Property
The Home Valuation Report is an in-depth analysis detailing your home's value as well as a comparison with similar homes in the area
Home Values in the Area
Average Home Value in this Area
Purchase History
| Date | Buyer | Sale Price | Title Company |
|---|---|---|---|
| Mcbride Nancy J | $164,500 | -- | |
| Curtis Sloan Matthew | $131,751 | -- | |
| Paul Mclaughlin | $141,000 | -- | |
| Landrum Jody K | $100,000 | -- | |
| Intorcia John L | $17,500 | -- | |
| Corley Donald R | -- | -- |
Source: Public Records
Mortgage History
| Date | Status | Borrower | Loan Amount |
|---|---|---|---|
| Previous Owner | Corley Donald R | $141,000 |
Source: Public Records
Tax History Compared to Growth
Tax History
| Year | Tax Paid | Tax Assessment Tax Assessment Total Assessment is a certain percentage of the fair market value that is determined by local assessors to be the total taxable value of land and additions on the property. | Land | Improvement |
|---|---|---|---|---|
| 2025 | -- | $76,625 | $13,750 | $62,875 |
| 2024 | $1,354 | $76,625 | $13,750 | $62,875 |
| 2023 | $1,354 | $76,625 | $13,750 | $62,875 |
| 2022 | $1,354 | $76,625 | $13,750 | $62,875 |
| 2021 | $1,354 | $56,425 | $10,500 | $45,925 |
| 2020 | $1,355 | $56,425 | $10,500 | $45,925 |
| 2019 | $1,355 | $56,425 | $10,500 | $45,925 |
| 2018 | $1,355 | $56,425 | $0 | $0 |
| 2017 | $1,355 | $42,275 | $0 | $0 |
| 2016 | $1,355 | $42,275 | $0 | $0 |
| 2015 | $1,363 | $42,275 | $0 | $0 |
| 2014 | $1,021 | $42,275 | $0 | $0 |
| 2013 | -- | $41,400 | $0 | $0 |
Source: Public Records
Map
Nearby Homes
- 715 Saint Francis Ave
- 650 Spring Hill Dr
- 502 Johnstown Dr
- 400 Megan Dr
- 502 Saint Francis Ave
- 532 Johnstown Dr
- 800 Bromley Ct
- 804 Bromley Ct
- 540 Johnstown Dr
- 508 Williamsport Dr
- 374 Rock Springs Rd
- 421 Saint Francis Ave
- 416 Mountain View Ct
- 103 Crestside Ct
- 610 Spring Hill Dr
- 506 Mountain View Ct
- 508 Mountain View Ct
- 305 Nasturtium Way
- 508 Spinnaker Ct
- 107 Crestside Ct
- 715 St Francis
- 719 Saint Francis Ave
- 216 Spring Hill Dr
- 218 Spring Hill Dr
- 214 Spring Hill Dr
- 713 Saint Francis Ave
- 722 Saint Francis Ave
- 724 Saint Francis Ave
- 721 Saint Francis Ave
- 720 Saint Francis Ave
- 212 Spring Hill Dr
- 726 Saint Francis Ave
- 728 Saint Francis Ave
- 711 Saint Francis Ave
- 718 Saint Francis Ave
- 210 Spring Hill Dr
- 0 Saint Francis Ave Unit RTC2311071
- 0 Saint Francis Ave
- 730 Saint Francis Ave
- 100 Andrea Cir