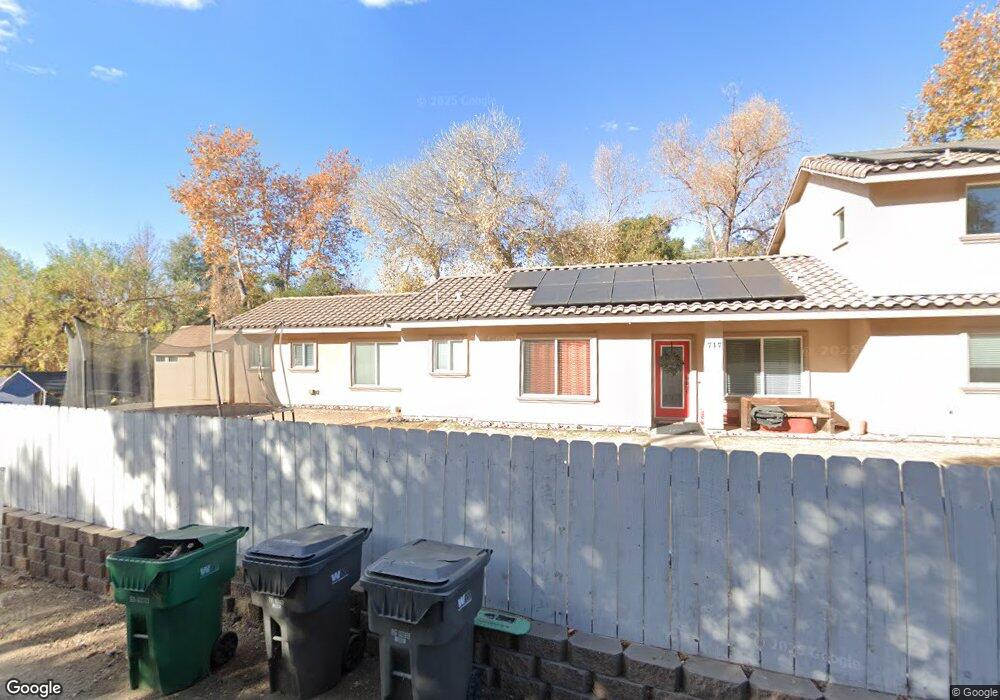
717 Silverbrook Dr El Cajon, CA 92019
Harbison Canyon NeighborhoodEstimated Value: $902,000 - $1,127,000
5
Beds
3
Baths
2,700
Sq Ft
$375/Sq Ft
Est. Value
About This Home
This home is located at 717 Silverbrook Dr, El Cajon, CA 92019 and is currently estimated at $1,011,438, approximately $374 per square foot. 717 Silverbrook Dr is a home located in San Diego County with nearby schools including Granite Hills High School and Cabrillo Point Academy.
Ownership History
Date
Name
Owned For
Owner Type
Purchase Details
Closed on
Oct 25, 2022
Sold by
Lepe Rufino and Lepe Frances
Bought by
Lepe Rufino and Lepe Frances
Current Estimated Value
Purchase Details
Closed on
Nov 2, 2016
Sold by
Marjanovich Joshua M and Marjanovich Danielle M
Bought by
Lepe Rufino and Lepe Frances
Home Financials for this Owner
Home Financials are based on the most recent Mortgage that was taken out on this home.
Original Mortgage
$440,000
Interest Rate
3.47%
Mortgage Type
New Conventional
Purchase Details
Closed on
Aug 7, 2013
Sold by
Velarde Builders Inc
Bought by
Marjanovich Joshua M and Marjanovich Danielle M
Home Financials for this Owner
Home Financials are based on the most recent Mortgage that was taken out on this home.
Original Mortgage
$382,500
Interest Rate
4.51%
Mortgage Type
New Conventional
Purchase Details
Closed on
Aug 6, 2013
Sold by
Velarde Ramon G and Velarde Ramon
Bought by
Velarde Builders Inc
Home Financials for this Owner
Home Financials are based on the most recent Mortgage that was taken out on this home.
Original Mortgage
$382,500
Interest Rate
4.51%
Mortgage Type
New Conventional
Purchase Details
Closed on
Aug 24, 2012
Sold by
Velarde Chelsea
Bought by
Velarde Ramon
Home Financials for this Owner
Home Financials are based on the most recent Mortgage that was taken out on this home.
Original Mortgage
$95,000
Interest Rate
3.59%
Mortgage Type
Seller Take Back
Purchase Details
Closed on
Apr 20, 2009
Sold by
Macfarlane Kathy J
Bought by
Macfarlane Thomas W
Purchase Details
Closed on
Mar 25, 2009
Sold by
Realholdings Llc
Bought by
Morcap Real Estate Opportunity Fund I Ll
Purchase Details
Closed on
Oct 31, 2008
Sold by
Hsbc Bank Usa National Association
Bought by
Blue Spruce Entities Llc
Purchase Details
Closed on
Oct 23, 2008
Sold by
Blue Spruce Entities Llc
Bought by
Realholdings Llc
Purchase Details
Closed on
Jun 4, 2008
Sold by
Bentley Patrick and Bentley Bianca
Bought by
Hsbc Bank Usa Na
Purchase Details
Closed on
Oct 15, 1996
Sold by
Walsh Kathleen A
Bought by
Bentley Patrick and Bentley Bianca
Home Financials for this Owner
Home Financials are based on the most recent Mortgage that was taken out on this home.
Original Mortgage
$127,704
Interest Rate
7.67%
Mortgage Type
FHA
Purchase Details
Closed on
Oct 13, 1995
Sold by
Walsh Richard E
Bought by
Walsh Kathleen A
Create a Home Valuation Report for This Property
The Home Valuation Report is an in-depth analysis detailing your home's value as well as a comparison with similar homes in the area
Home Values in the Area
Average Home Value in this Area
Purchase History
| Date | Buyer | Sale Price | Title Company |
|---|---|---|---|
| Lepe Rufino | -- | -- | |
| Lepe Rufino | $520,000 | Stewart Title | |
| Marjanovich Joshua M | $450,000 | Lawyers Title | |
| Velarde Builders Inc | -- | Lawyers Title Sd | |
| Velarde Ramon | -- | Lawyers Title Sd | |
| Velarde Ramon G | -- | Lawyers Title Sd | |
| Velarde Ramon G | $105,000 | Lawyers Title Sd | |
| Macfarlane Thomas W | -- | Fidelity National Title Co | |
| Macfarlane Thomas W | $19,500 | Fidelity National Title Co | |
| Morcap Real Estate Opportunity Fund I Ll | -- | Chicago Title Servicelink Di | |
| Blue Spruce Entities Llc | -- | None Available | |
| Realholdings Llc | $2,729 | Chicago Title | |
| Hsbc Bank Usa Na | $56,385 | None Available | |
| Hsbc Bank Usa Na | $56,385 | Fidelity National Title | |
| Bentley Patrick | $130,000 | Commonwealth Land Title Co | |
| Walsh Kathleen A | -- | -- |
Source: Public Records
Mortgage History
| Date | Status | Borrower | Loan Amount |
|---|---|---|---|
| Previous Owner | Lepe Rufino | $440,000 | |
| Previous Owner | Marjanovich Joshua M | $382,500 | |
| Previous Owner | Velarde Ramon G | $95,000 | |
| Previous Owner | Bentley Patrick | $127,704 |
Source: Public Records
Tax History Compared to Growth
Tax History
| Year | Tax Paid | Tax Assessment Tax Assessment Total Assessment is a certain percentage of the fair market value that is determined by local assessors to be the total taxable value of land and additions on the property. | Land | Improvement |
|---|---|---|---|---|
| 2025 | $7,440 | $658,638 | $232,010 | $426,628 |
| 2024 | $7,440 | $645,724 | $227,461 | $418,263 |
| 2023 | $7,304 | $610,063 | $223,001 | $387,062 |
| 2022 | $6,907 | $568,690 | $218,629 | $350,061 |
| 2021 | $7,104 | $557,541 | $214,343 | $343,198 |
| 2020 | $6,765 | $551,825 | $212,146 | $339,679 |
| 2019 | $6,639 | $541,006 | $207,987 | $333,019 |
| 2018 | $6,500 | $530,399 | $203,909 | $326,490 |
| 2017 | $6,403 | $520,000 | $199,911 | $320,089 |
| 2016 | $5,634 | $465,988 | $179,146 | $286,842 |
| 2015 | $5,607 | $458,990 | $176,456 | $282,534 |
| 2014 | $5,474 | $450,000 | $173,000 | $277,000 |
Source: Public Records
Map
Nearby Homes
- 0 Silverbrook Dr Unit PTP2505360
- 0 Silverbrook Dr Unit PTP2505357
- 111 La Cresta Trail
- 1119 Saint George Dr
- 965 Harbison Canyon Rd
- 447 Patrick Dr
- 1010 1/2 Wilson Ave
- 250 Editha Dr
- 1152 Stoneridge Rd
- 1140 Old Mountain View Rd
- 0 Harbison Canyon Rd Unit PTP2600013
- 1496 Montana Serena Ct
- 1631 Harbison Canyon Rd Unit 26
- 1631 Harbison Canyon Rd Unit 24
- 1631 Harbison Canyon Rd Unit 77
- 1131 Dehesa Ranch Rd
- 497 Mountain View Rd
- 5676 Dehesa Rd
- 6433 Dehesa Rd
- 296 East Ln
- 0 Silverbrook Dr Unit CRPTP2403333
- 0 Silverbrook Dr Unit PTP2403333
- 0 Silverbrook Dr Unit PTP2305877
- 0 Silverbrook Dr Unit 3 & 4 180012496
- 0 Silverbrook Trail Unit 3 & 4
- 0 Silverbrook Dr
- 716 Harbison Canyon Rd
- 488 Silverbrook Dr
- 716 Silverbrook Dr
- 707 Silverbrook Dr
- 726 Harbison Canyon Rd
- 737 Silverbrook Dr
- 732 Silverbrook Dr
- 700 Silverbrook Dr
- 715 Harbison Canyon Rd
- 653 Silverbrook Dr
- 638 Saint George Dr
- 731 Harbison Canyon Rd
- 744 Harbison Canyon Rd
- 744 Silverbrook Dr