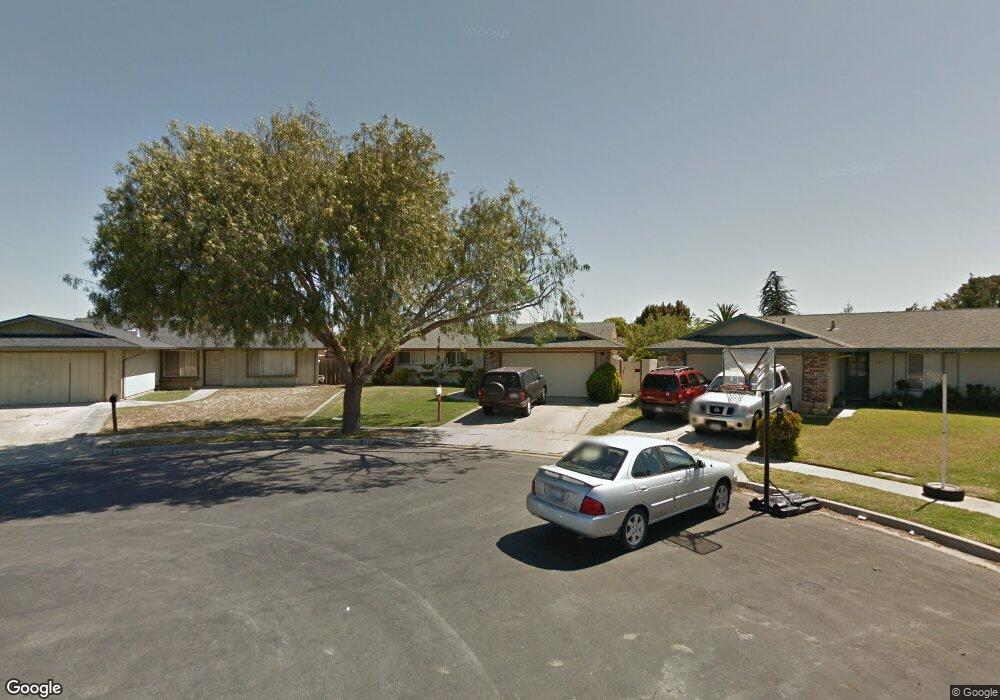
717 Sloat Cir Unit 5 Salinas, CA 93907
Boronda NeighborhoodEstimated Value: $638,000 - $689,000
3
Beds
2
Baths
1,194
Sq Ft
$558/Sq Ft
Est. Value
About This Home
This home is located at 717 Sloat Cir Unit 5, Salinas, CA 93907 and is currently estimated at $666,428, approximately $558 per square foot. 717 Sloat Cir Unit 5 is a home located in Monterey County with nearby schools including Laurel Wood Elementary School, Roosevelt Elementary School, and Washington Middle School.
Ownership History
Date
Name
Owned For
Owner Type
Purchase Details
Closed on
Apr 10, 2000
Sold by
Flores Estanislao
Bought by
Flores Ruben and Flores Irma
Current Estimated Value
Purchase Details
Closed on
Mar 28, 1994
Sold by
Flores Concepcion
Bought by
Flores Estanislao
Purchase Details
Closed on
Jan 11, 1994
Sold by
Frank Don R and Frank Ernestine S
Bought by
Flores Ruben C and Flores Irma
Home Financials for this Owner
Home Financials are based on the most recent Mortgage that was taken out on this home.
Original Mortgage
$148,000
Interest Rate
4%
Create a Home Valuation Report for This Property
The Home Valuation Report is an in-depth analysis detailing your home's value as well as a comparison with similar homes in the area
Home Values in the Area
Average Home Value in this Area
Purchase History
| Date | Buyer | Sale Price | Title Company |
|---|---|---|---|
| Flores Ruben | -- | -- | |
| Flores Estanislao | -- | First American Title Co | |
| Flores Ruben C | $168,000 | First American Title Co |
Source: Public Records
Mortgage History
| Date | Status | Borrower | Loan Amount |
|---|---|---|---|
| Previous Owner | Flores Ruben C | $148,000 |
Source: Public Records
Tax History Compared to Growth
Tax History
| Year | Tax Paid | Tax Assessment Tax Assessment Total Assessment is a certain percentage of the fair market value that is determined by local assessors to be the total taxable value of land and additions on the property. | Land | Improvement |
|---|---|---|---|---|
| 2025 | $3,222 | $285,524 | $135,963 | $149,561 |
| 2024 | $3,222 | $279,927 | $133,298 | $146,629 |
| 2023 | $3,112 | $274,439 | $130,685 | $143,754 |
| 2022 | $2,994 | $269,059 | $128,123 | $140,936 |
| 2021 | $2,875 | $263,784 | $125,611 | $138,173 |
| 2020 | $2,795 | $261,081 | $124,324 | $136,757 |
| 2019 | $2,772 | $255,963 | $121,887 | $134,076 |
| 2018 | $2,734 | $250,946 | $119,498 | $131,448 |
| 2017 | $2,735 | $246,026 | $117,155 | $128,871 |
| 2016 | $2,735 | $241,203 | $114,858 | $126,345 |
| 2015 | $2,758 | $237,581 | $113,133 | $124,448 |
| 2014 | $2,572 | $232,928 | $110,917 | $122,011 |
Source: Public Records
Map
Nearby Homes
- 983 Flint Way
- 1055 Howe Cir
- 549 Powell St
- 515 Stockton St
- 424 Brighton St
- 350 Victor St
- 417 Tyler Place Unit I
- 114 Iris Dr
- 1117 Baldwin St Unit 6
- 1117 Baldwin St Unit 5
- 29 Buena Vista St
- 230 Martella St
- 23 Capitol St
- 129 Rodeo Ave
- 315 Archer St
- 315 3151/2 Archer St
- 216 Crescent Way
- 44 Oconnor Cir
- 840 Archer St
- 225 Loma Dr