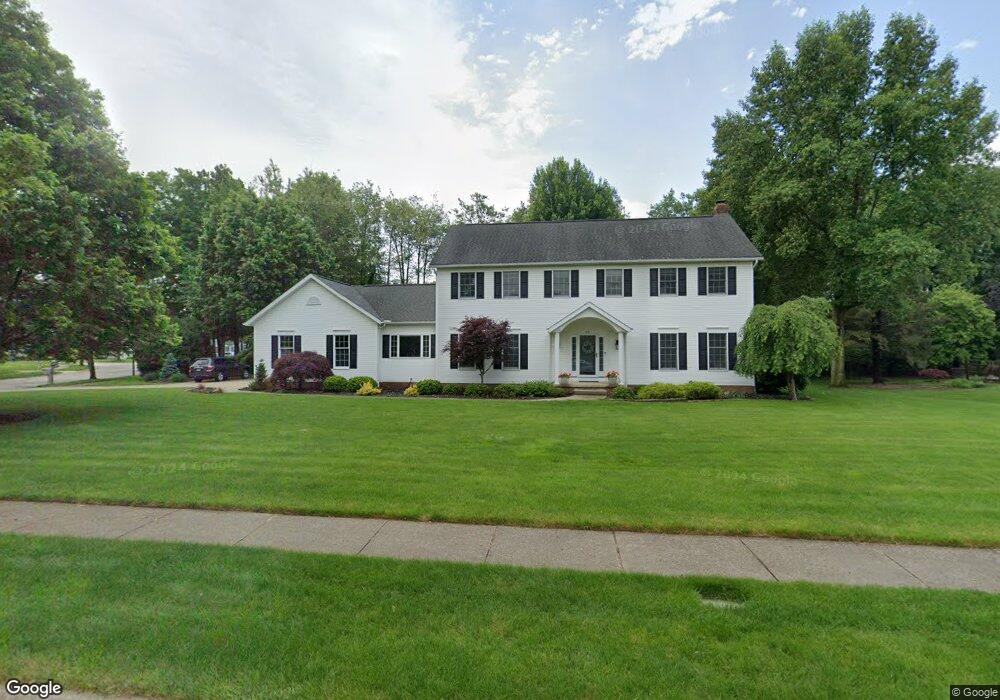
717 Sunridge Rd Fairlawn, OH 44333
Estimated Value: $502,788 - $568,000
4
Beds
3
Baths
2,836
Sq Ft
$188/Sq Ft
Est. Value
About This Home
This home is located at 717 Sunridge Rd, Fairlawn, OH 44333 and is currently estimated at $533,197, approximately $188 per square foot. 717 Sunridge Rd is a home located in Summit County with nearby schools including Copley-Fairlawn Middle School, Copley High School, and Spring Garden Waldorf School.
Ownership History
Date
Name
Owned For
Owner Type
Purchase Details
Closed on
Dec 4, 2023
Sold by
Fearon Kevin R and Fearon Vicki S
Bought by
Fearon Trust and Fearon
Current Estimated Value
Purchase Details
Closed on
Nov 15, 2023
Sold by
Fearon Kevin R and Fearon Vicki S
Bought by
Fearon Trust and Fearon
Purchase Details
Closed on
Dec 6, 2002
Sold by
Cendant Mobility Financial Corp
Bought by
Fearon Kevin R and Fearon Vicki S
Home Financials for this Owner
Home Financials are based on the most recent Mortgage that was taken out on this home.
Original Mortgage
$80,000
Interest Rate
6.38%
Purchase Details
Closed on
Aug 10, 2002
Sold by
Chase Mary E James D Trustees
Bought by
Cendant Mobility Financial Corp
Create a Home Valuation Report for This Property
The Home Valuation Report is an in-depth analysis detailing your home's value as well as a comparison with similar homes in the area
Home Values in the Area
Average Home Value in this Area
Purchase History
| Date | Buyer | Sale Price | Title Company |
|---|---|---|---|
| Fearon Trust | -- | None Listed On Document | |
| Fearon Trust | -- | None Listed On Document | |
| Fearon Kevin R | $318,000 | Midland Commerce Group | |
| Cendant Mobility Financial Corp | $318,000 | Midland Commerce Group |
Source: Public Records
Mortgage History
| Date | Status | Borrower | Loan Amount |
|---|---|---|---|
| Previous Owner | Fearon Kevin R | $80,000 | |
| Closed | Fearon Kevin R | $170,000 |
Source: Public Records
Tax History Compared to Growth
Tax History
| Year | Tax Paid | Tax Assessment Tax Assessment Total Assessment is a certain percentage of the fair market value that is determined by local assessors to be the total taxable value of land and additions on the property. | Land | Improvement |
|---|---|---|---|---|
| 2025 | $5,380 | $135,972 | $26,793 | $109,179 |
| 2024 | $5,380 | $135,972 | $26,793 | $109,179 |
| 2023 | $5,380 | $135,972 | $26,793 | $109,179 |
| 2022 | $5,511 | $115,325 | $22,708 | $92,617 |
| 2021 | $5,175 | $115,325 | $22,708 | $92,617 |
| 2020 | $5,059 | $115,330 | $22,710 | $92,620 |
| 2019 | $5,997 | $122,610 | $23,090 | $99,520 |
| 2018 | $5,875 | $122,610 | $23,090 | $99,520 |
| 2017 | $5,516 | $122,610 | $23,090 | $99,520 |
| 2016 | $5,516 | $107,830 | $20,440 | $87,390 |
| 2015 | $5,516 | $107,830 | $20,440 | $87,390 |
| 2014 | $5,496 | $107,830 | $20,440 | $87,390 |
| 2013 | $5,590 | $109,970 | $20,440 | $89,530 |
Source: Public Records
Map
Nearby Homes
- 2957 Greenspire Ln
- 600 White Tail Ridge Dr
- V/L White Tail Ridge Dr
- 2845 Orchard Grove Ct
- 0 Brunsdorph Rd
- 786 Brunsdorph Rd
- 804 Miramar Ln
- 793 Miramar Ln
- 848 Jacoby Rd
- 3201 Ridgewood Rd
- 3241 Ridgewood Rd
- 487 Beaumont Dr
- 342 S Miller Rd
- 482 Gresham Dr
- 2622 Twin Creeks Dr
- 67 Quaker Ridge Dr
- 360 Marviel Dr
- 288 Kenridge Rd
- 0 Kumho Dr
- 2622 Stonecreek Dr
- 2965 Greenspire Ln
- 2507 Shadow Ridge Ln
- 706 Sunridge Rd
- 718 Sunridge Rd
- 2972 Greenspire Ln
- 2488 Shadow Ridge Ln
- 737 Sunridge Rd
- 694 Sunridge Rd
- 2489 Shadow Ridge Ln
- 726 Sunridge Rd
- 2951 Greenspire Ln
- 682 Sunridge Rd
- 2966 Greenspire Ln
- 679 Sunridge Rd
- 2480 Shadow Ridge Ln
- 734 Sunridge Rd
- 745 Sunridge Rd
- 2471 Shadow Ridge Ln
- 2945 Greenspire Cir
- 670 Sunridge Rd