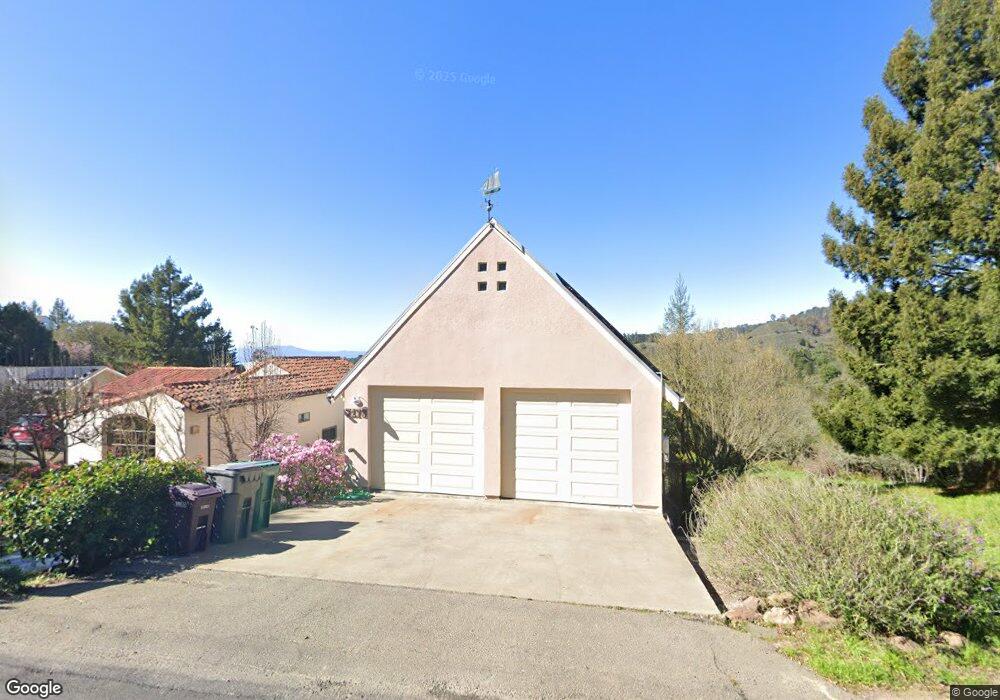
7173 Norfolk Rd Berkeley, CA 94705
Claremont Hills NeighborhoodEstimated Value: $2,226,729 - $2,398,000
4
Beds
4
Baths
4,088
Sq Ft
$565/Sq Ft
Est. Value
About This Home
This home is located at 7173 Norfolk Rd, Berkeley, CA 94705 and is currently estimated at $2,310,182, approximately $565 per square foot. 7173 Norfolk Rd is a home located in Alameda County with nearby schools including Chabot Elementary School, Thornhill Elementary School, and Claremont Middle School.
Ownership History
Date
Name
Owned For
Owner Type
Purchase Details
Closed on
Jul 15, 2019
Sold by
Shane Roger and Alford Darlene
Bought by
Shane Roger B and The Roger Shane 2019 Living Tr
Current Estimated Value
Purchase Details
Closed on
Oct 6, 2017
Sold by
Shane Roger and Alford Darlene
Bought by
Shane Roger and Alford Darlene
Home Financials for this Owner
Home Financials are based on the most recent Mortgage that was taken out on this home.
Original Mortgage
$275,000
Outstanding Balance
$229,702
Interest Rate
3.82%
Mortgage Type
New Conventional
Estimated Equity
$2,080,480
Purchase Details
Closed on
Dec 31, 2015
Sold by
Shane Roger
Bought by
Alford Darlene and Alford Shane Roger
Purchase Details
Closed on
May 18, 2015
Sold by
Shane Roger B and Simi Pamela E
Bought by
Shane Roger B
Purchase Details
Closed on
Jul 16, 2004
Sold by
Shane Roger and Simi Pamela
Bought by
Shane Roger B and Simi Pamela S
Purchase Details
Closed on
Oct 19, 1999
Sold by
D W August Company
Bought by
Shane Roger and Simi Pamela
Create a Home Valuation Report for This Property
The Home Valuation Report is an in-depth analysis detailing your home's value as well as a comparison with similar homes in the area
Home Values in the Area
Average Home Value in this Area
Purchase History
| Date | Buyer | Sale Price | Title Company |
|---|---|---|---|
| Shane Roger B | -- | None Available | |
| Shane Roger | -- | First American Title Company | |
| Alford Darlene | -- | None Available | |
| Shane Roger B | -- | None Available | |
| Shane Roger B | -- | -- | |
| Shane Roger | $1,140,000 | Fidelity National Title Co |
Source: Public Records
Mortgage History
| Date | Status | Borrower | Loan Amount |
|---|---|---|---|
| Open | Shane Roger | $275,000 |
Source: Public Records
Tax History
| Year | Tax Paid | Tax Assessment Tax Assessment Total Assessment is a certain percentage of the fair market value that is determined by local assessors to be the total taxable value of land and additions on the property. | Land | Improvement |
|---|---|---|---|---|
| 2025 | $23,250 | $1,745,054 | $525,616 | $1,226,438 |
| 2024 | $23,250 | $1,710,705 | $515,311 | $1,202,394 |
| 2023 | $24,645 | $1,684,030 | $505,209 | $1,178,821 |
| 2022 | $24,240 | $1,644,015 | $495,304 | $1,155,711 |
| 2021 | $23,394 | $1,611,651 | $485,595 | $1,133,056 |
| 2020 | $23,145 | $1,602,064 | $480,619 | $1,121,445 |
| 2019 | $22,713 | $1,570,657 | $471,197 | $1,099,460 |
| 2018 | $22,252 | $1,539,865 | $461,959 | $1,077,906 |
| 2017 | $21,477 | $1,509,678 | $452,903 | $1,056,775 |
| 2016 | $20,972 | $1,480,084 | $444,025 | $1,036,059 |
| 2015 | $20,876 | $1,457,854 | $437,356 | $1,020,498 |
| 2014 | $21,387 | $1,429,297 | $428,789 | $1,000,508 |
Source: Public Records
Map
Nearby Homes
- 7101 Marlborough Terrace
- 7041 Devon Way
- 7003 Buckingham Blvd
- 0 Buckingham Blvd Unit 41115384
- 6971 Bristol Dr
- 0 Gypsy Ln
- 1383 Alvarado Rd
- 1375 Alvarado Rd
- 0 Dartmouth Dr
- 6869 Bristol Dr
- 280 Caldecott Ln Unit 221
- 1102 Grand View Dr
- 6716 Charing Cross Rd
- 6839 Sherwick Dr
- 29 Live Oak Rd
- 1881 Grand View Dr
- 180 Caldecott Ln Unit 314
- 7723 Claremont Ave
- 1426 Grand View Dr
- 320 Caldecott Ln Unit 116
- 7171 Norfolk Rd
- 7161 Norfolk Rd
- 7172 Norfolk Rd
- 7174 Norfolk Rd
- 7155 Norfolk Rd
- 7156 Norfolk Rd
- 7149 Norfolk Rd
- 7150 Norfolk Rd
- 7155 Marlborough Terrace
- 7133 Norfolk Rd
- 134 Strathmoor Dr
- 142 Strathmoor Dr
- 122 Strathmoor Dr
- 7121 Norfolk Rd
- 7145 Marlborough Terrace
- 0 Marlborough Terrace
- 114 Strathmoor Dr
- 7160 Marlborough Terrace
- 7124 Norfolk Rd
- 7156 Marlborough Terrace
Your Personal Tour Guide
Ask me questions while you tour the home.