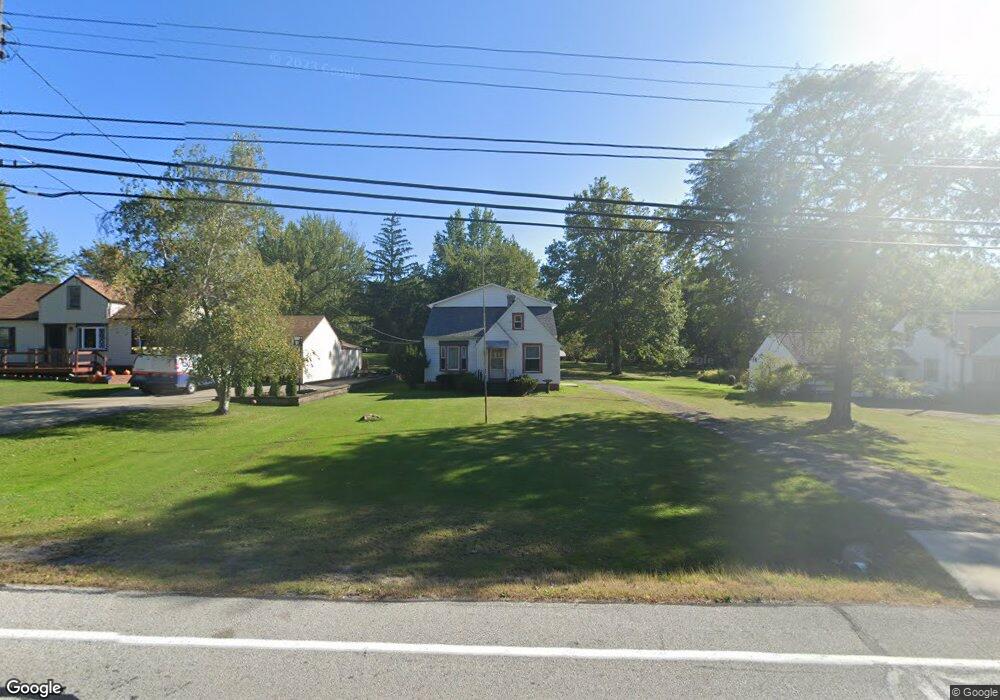
7179 Wallings Rd North Royalton, OH 44133
Estimated Value: $295,000 - $385,000
4
Beds
2
Baths
2,362
Sq Ft
$137/Sq Ft
Est. Value
About This Home
This home is located at 7179 Wallings Rd, North Royalton, OH 44133 and is currently estimated at $324,093, approximately $137 per square foot. 7179 Wallings Rd is a home located in Cuyahoga County with nearby schools including North Royalton Middle School, North Royalton High School, and Saint Albert the Great Roman Catholic School.
Ownership History
Date
Name
Owned For
Owner Type
Purchase Details
Closed on
Jun 11, 2025
Sold by
Conlin Myra A
Bought by
M A Conlin Trust and Conlin
Current Estimated Value
Purchase Details
Closed on
Jan 30, 2014
Sold by
Conlin Paul
Bought by
Conlin Myra A
Home Financials for this Owner
Home Financials are based on the most recent Mortgage that was taken out on this home.
Original Mortgage
$125,899
Interest Rate
2.99%
Mortgage Type
VA
Purchase Details
Closed on
May 11, 1992
Sold by
Macphee David A
Bought by
Conlin Paul
Purchase Details
Closed on
Oct 31, 1984
Sold by
Abram Robert A
Bought by
Simandl Albina
Purchase Details
Closed on
Sep 9, 1981
Sold by
Anna Kotora
Bought by
Abram Robert A
Purchase Details
Closed on
Sep 4, 1981
Sold by
Kotora Anna
Bought by
Anna Kotora
Purchase Details
Closed on
Jan 1, 1975
Bought by
Kotora Anna
Create a Home Valuation Report for This Property
The Home Valuation Report is an in-depth analysis detailing your home's value as well as a comparison with similar homes in the area
Home Values in the Area
Average Home Value in this Area
Purchase History
| Date | Buyer | Sale Price | Title Company |
|---|---|---|---|
| M A Conlin Trust | -- | Ohio Real Title | |
| Conlin Myra A | -- | Attorney | |
| Conlin Paul | $82,000 | -- | |
| Macphee David A | -- | -- | |
| Simandl Albina | $68,000 | -- | |
| Abram Robert A | $70,000 | -- | |
| Anna Kotora | -- | -- | |
| Kotora Anna | -- | -- |
Source: Public Records
Mortgage History
| Date | Status | Borrower | Loan Amount |
|---|---|---|---|
| Previous Owner | Conlin Myra A | $125,899 |
Source: Public Records
Tax History Compared to Growth
Tax History
| Year | Tax Paid | Tax Assessment Tax Assessment Total Assessment is a certain percentage of the fair market value that is determined by local assessors to be the total taxable value of land and additions on the property. | Land | Improvement |
|---|---|---|---|---|
| 2024 | $4,774 | $82,180 | $19,075 | $63,105 |
| 2023 | $4,631 | $73,120 | $15,510 | $57,610 |
| 2022 | $4,600 | $73,120 | $15,510 | $57,610 |
| 2021 | $4,648 | $73,120 | $15,510 | $57,610 |
| 2020 | $4,216 | $63,040 | $13,370 | $49,670 |
| 2019 | $4,093 | $180,100 | $38,200 | $141,900 |
| 2018 | $4,136 | $63,040 | $13,370 | $49,670 |
| 2017 | $4,060 | $59,090 | $13,410 | $45,680 |
| 2016 | $3,804 | $59,090 | $13,410 | $45,680 |
| 2015 | $3,834 | $59,090 | $13,410 | $45,680 |
| 2014 | $3,834 | $59,090 | $13,410 | $45,680 |
Source: Public Records
Map
Nearby Homes
- 7332 Creekwood Dr Unit 4B
- 12701 Gordon St
- 7554 Margaret Dr
- 7595 Margaret Dr
- 7545 Margaret Dr
- 7585 Margaret Dr
- 7575 Margaret Dr
- 7535 Margaret Dr
- 7555 Margaret Dr
- 7600 Margaret Dr
- 7564 Margaret Dr
- 7574 Margaret Dr
- S/L Margaret Dr
- 10628 Devonshire Dr
- 12906 Cartwright Pkwy
- 13000 Cartwright Pkwy
- 9035 Wallings Rd
- 7635 Harley Hills Dr
- 6560 Queens Way
- 11658 York Rd
- 7211 Wallings Rd
- 7223 Wallings Rd
- 7261 Wallings Rd
- 7170 Wallings Rd
- 7134 Wallings Rd
- 7216 Wallings Rd
- 7297 Wallings Rd
- 12022 Ridge Rd
- 7258 Wallings Rd
- 12062 Ridge Rd
- 7331 Wallings Rd
- 11936 Ridge Rd
- 12102 Ridge Rd
- 12014 Ridge Rd
- 11890 Ridge Rd
- 7373 Wallings Rd
- 12144 Ridge Rd
- V/L Wallings Rd
- 12184 Ridge Rd
- 7413 Wallings Rd