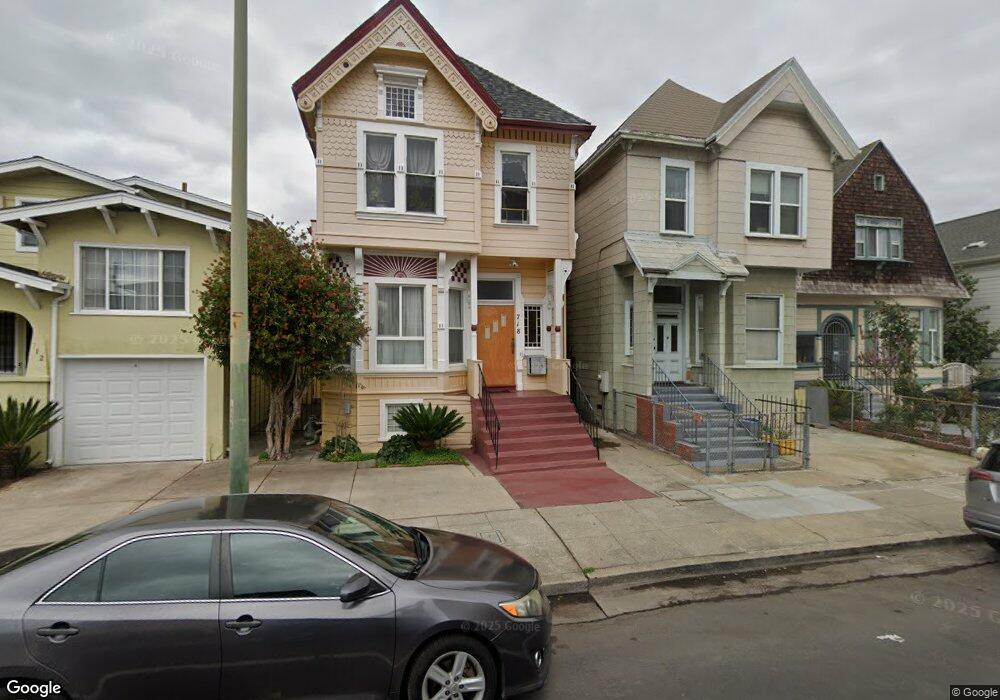
718 E 15th St Oakland, CA 94606
Clinton NeighborhoodEstimated Value: $677,000 - $736,000
2
Beds
4
Baths
2,116
Sq Ft
$334/Sq Ft
Est. Value
About This Home
This home is located at 718 E 15th St, Oakland, CA 94606 and is currently estimated at $706,000, approximately $333 per square foot. 718 E 15th St is a home located in Alameda County with nearby schools including Franklin Elementary School, Roosevelt Middle School, and Oakland High School.
Ownership History
Date
Name
Owned For
Owner Type
Purchase Details
Closed on
Oct 14, 2025
Sold by
Dugay Emil Ramil and Dugay Lilia O
Bought by
Emil R Dugay And Lilia O Dugay Revocable Trus and Dugay
Current Estimated Value
Purchase Details
Closed on
May 10, 2001
Sold by
Luluquisen Isabel M and Dugay Emil Ramil
Bought by
Dugay Emil Ramil and Dugay Lilia
Purchase Details
Closed on
Nov 25, 2000
Sold by
Luluquisen Isabel M and Luluquisen Isabela Marcela
Bought by
Luluquisen Isabela Marcela and The Luluquisen Revocable Trust
Purchase Details
Closed on
Jul 25, 1995
Sold by
Mcfann Catherine J and Martin Ruth Collier
Bought by
Luluquisen Isabel M and Dugay Emil Ramil
Create a Home Valuation Report for This Property
The Home Valuation Report is an in-depth analysis detailing your home's value as well as a comparison with similar homes in the area
Home Values in the Area
Average Home Value in this Area
Purchase History
| Date | Buyer | Sale Price | Title Company |
|---|---|---|---|
| Emil R Dugay And Lilia O Dugay Revocable Trus | -- | None Listed On Document | |
| Dugay Emil Ramil | -- | -- | |
| Luluquisen Isabela Marcela | -- | -- | |
| Luluquisen Isabel M | -- | -- | |
| Luluquisen Isabel M | -- | -- |
Source: Public Records
Tax History
| Year | Tax Paid | Tax Assessment Tax Assessment Total Assessment is a certain percentage of the fair market value that is determined by local assessors to be the total taxable value of land and additions on the property. | Land | Improvement |
|---|---|---|---|---|
| 2025 | $6,866 | $304,889 | $90,403 | $214,486 |
| 2024 | $6,866 | $298,911 | $88,631 | $210,280 |
| 2023 | $7,023 | $293,051 | $86,893 | $206,158 |
| 2022 | $6,636 | $287,307 | $85,190 | $202,117 |
| 2021 | $6,039 | $281,673 | $83,520 | $198,153 |
| 2020 | $5,965 | $278,785 | $82,663 | $196,122 |
| 2019 | $5,543 | $273,320 | $81,043 | $192,277 |
| 2018 | $5,429 | $267,962 | $79,454 | $188,508 |
| 2017 | $5,135 | $262,708 | $77,896 | $184,812 |
| 2016 | $4,918 | $257,558 | $76,369 | $181,189 |
| 2015 | $4,887 | $253,692 | $75,223 | $178,469 |
| 2014 | $5,048 | $248,724 | $73,750 | $174,974 |
Source: Public Records
Map
Nearby Homes
- 635 E 15th St
- 1439 7th Ave
- 1444 9th Ave
- 1532 5th Ave
- 842 E 17th St
- 1549 5th Ave
- 1431 5th Ave Unit 2
- 415 Foothill Blvd
- 414 E 12th St
- 1005 E 12th St
- 812 E 19th St
- 836 E 19th St
- 1004 9th Ave
- 425 E 11th St Unit 17
- 1011 E 11th St
- 1155 International Blvd
- 1018 4th Ave Unit 118
- 816 7th Ave
- 501 E 20th St
- 812 6th Ave
Your Personal Tour Guide
Ask me questions while you tour the home.