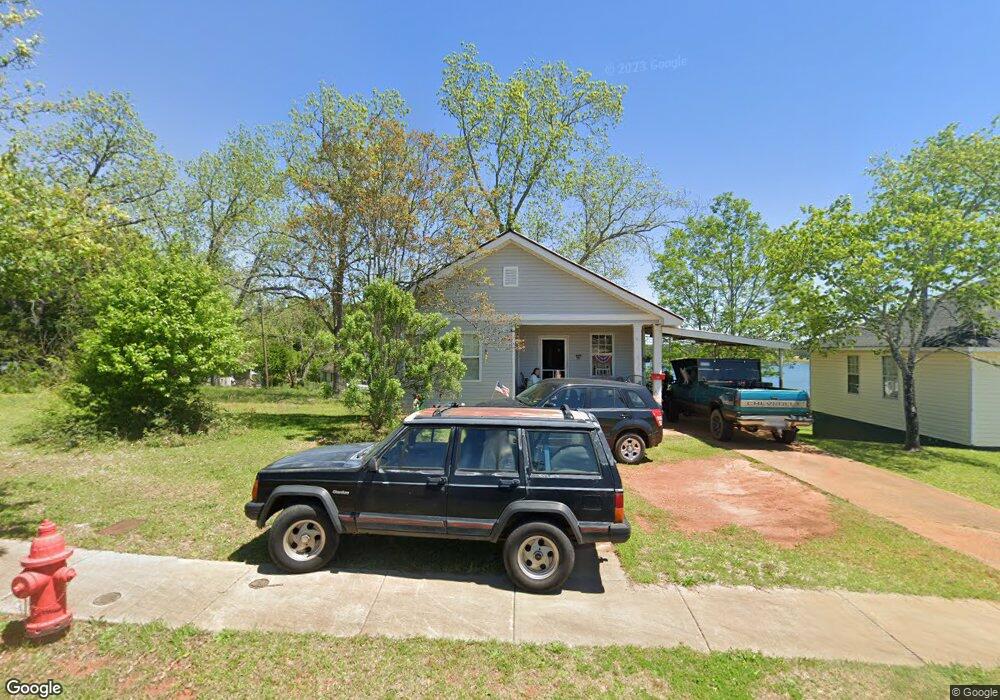
718 E Goodrich Ave Thomaston, GA 30286
Estimated Value: $74,519 - $114,000
1
Bed
1
Bath
956
Sq Ft
$100/Sq Ft
Est. Value
About This Home
This home is located at 718 E Goodrich Ave, Thomaston, GA 30286 and is currently estimated at $95,880, approximately $100 per square foot. 718 E Goodrich Ave is a home located in Upson County with nearby schools including Upson-Lee South Elementary School, Upson-Lee North Elementary School, and Upson-Lee Middle School.
Ownership History
Date
Name
Owned For
Owner Type
Purchase Details
Closed on
Jun 26, 2023
Sold by
Raybon Angela M
Bought by
Raybon Robert Dan
Current Estimated Value
Purchase Details
Closed on
Jun 22, 2022
Sold by
Rapillaed Ben W
Bought by
Raybon Angela M and Raybon Robert Dan
Home Financials for this Owner
Home Financials are based on the most recent Mortgage that was taken out on this home.
Original Mortgage
$55,000
Interest Rate
5.1%
Mortgage Type
New Conventional
Create a Home Valuation Report for This Property
The Home Valuation Report is an in-depth analysis detailing your home's value as well as a comparison with similar homes in the area
Purchase History
| Date | Buyer | Sale Price | Title Company |
|---|---|---|---|
| Raybon Robert Dan | -- | -- | |
| Raybon Angela M | $55,000 | -- |
Source: Public Records
Mortgage History
| Date | Status | Borrower | Loan Amount |
|---|---|---|---|
| Previous Owner | Raybon Angela M | $55,000 |
Source: Public Records
Tax History
| Year | Tax Paid | Tax Assessment Tax Assessment Total Assessment is a certain percentage of the fair market value that is determined by local assessors to be the total taxable value of land and additions on the property. | Land | Improvement |
|---|---|---|---|---|
| 2025 | $999 | $34,203 | $3,200 | $31,003 |
| 2024 | $999 | $26,608 | $3,200 | $23,408 |
| 2023 | $800 | $25,410 | $3,200 | $22,210 |
| 2022 | $489 | $17,574 | $3,200 | $14,374 |
| 2021 | $480 | $16,847 | $3,200 | $13,647 |
| 2020 | $293 | $9,606 | $3,200 | $6,406 |
| 2019 | $338 | $10,657 | $4,800 | $5,857 |
| 2018 | $284 | $9,401 | $4,800 | $4,601 |
| 2017 | $207 | $5,922 | $1,600 | $4,322 |
| 2016 | $250 | $7,039 | $1,600 | $5,439 |
| 2015 | $248 | $7,039 | $1,600 | $5,439 |
| 2014 | $249 | $7,039 | $1,600 | $5,439 |
Source: Public Records
Map
Nearby Homes
- 106 C St NE
- 114 C St NE
- 74 E St
- 119 F St
- 354 S Main St
- 0 12th Ave Unit 10630351
- 201 4th Ave SE
- 100 Beaver Run Trace
- 458 E St
- 40 Edgewood Ave
- 719 9th Ave
- 0 9th Ave Unit 10500756
- 516 W Goodrich Ave
- 228 R St NW
- 03 Multiple Rental Houses
- 146 O St NW
- 300 Poplar Dr
- 600 4th Ave SW
- 503 N Church St
- 0 Goodrich Ave N Unit 10690948
Your Personal Tour Guide
Ask me questions while you tour the home.