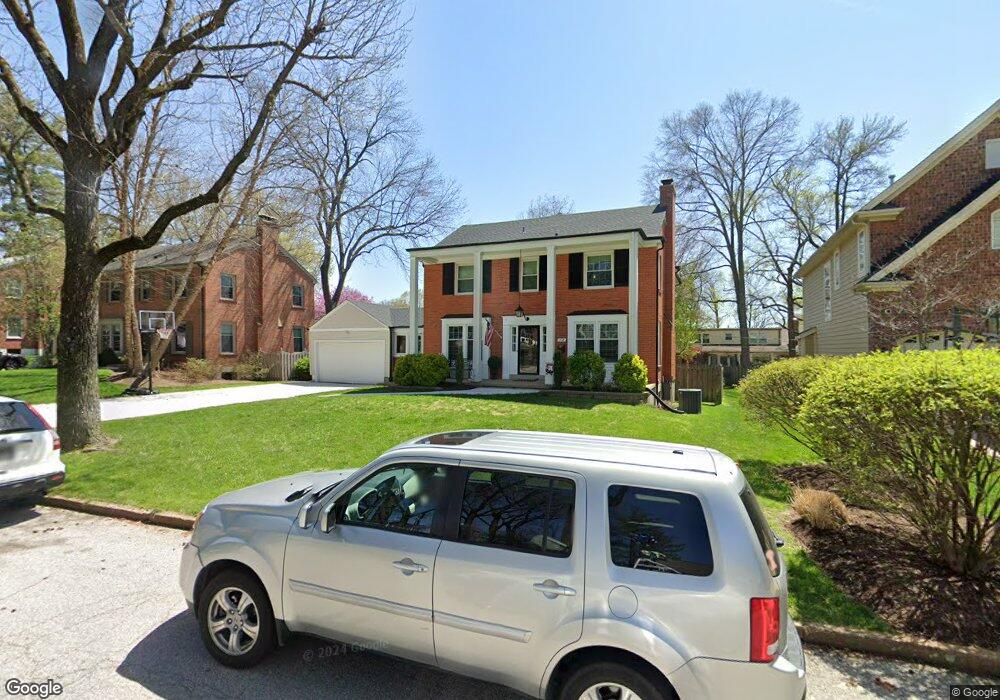
718 Elmtree Ln Saint Louis, MO 63122
Estimated Value: $569,000 - $654,000
3
Beds
2
Baths
1,821
Sq Ft
$335/Sq Ft
Est. Value
About This Home
This home is located at 718 Elmtree Ln, Saint Louis, MO 63122 and is currently estimated at $610,400, approximately $335 per square foot. 718 Elmtree Ln is a home located in St. Louis County with nearby schools including W.W. Keysor Elementary School, North Kirkwood Middle School, and Kirkwood Senior High School.
Ownership History
Date
Name
Owned For
Owner Type
Purchase Details
Closed on
Nov 17, 2014
Sold by
Gale Wesley M and Oneill Kathryn J
Bought by
Gale Wesley M and Gale Kathryn J
Current Estimated Value
Home Financials for this Owner
Home Financials are based on the most recent Mortgage that was taken out on this home.
Original Mortgage
$250,750
Outstanding Balance
$191,586
Interest Rate
3.93%
Mortgage Type
New Conventional
Estimated Equity
$418,814
Purchase Details
Closed on
Nov 15, 2012
Sold by
Us Bank Na
Bought by
Gale Wesley M and Oneill Kathryn J
Home Financials for this Owner
Home Financials are based on the most recent Mortgage that was taken out on this home.
Original Mortgage
$261,250
Interest Rate
3.25%
Mortgage Type
FHA
Purchase Details
Closed on
Jun 3, 2011
Sold by
Polst Dorothea
Bought by
Polst Dorothea H
Create a Home Valuation Report for This Property
The Home Valuation Report is an in-depth analysis detailing your home's value as well as a comparison with similar homes in the area
Home Values in the Area
Average Home Value in this Area
Purchase History
| Date | Buyer | Sale Price | Title Company |
|---|---|---|---|
| Gale Wesley M | -- | Title Partners Agency Llc | |
| Gale Wesley M | $275,000 | Ctc | |
| Polst Dorothea H | -- | None Available |
Source: Public Records
Mortgage History
| Date | Status | Borrower | Loan Amount |
|---|---|---|---|
| Open | Gale Wesley M | $250,750 | |
| Closed | Gale Wesley M | $261,250 |
Source: Public Records
Tax History Compared to Growth
Tax History
| Year | Tax Paid | Tax Assessment Tax Assessment Total Assessment is a certain percentage of the fair market value that is determined by local assessors to be the total taxable value of land and additions on the property. | Land | Improvement |
|---|---|---|---|---|
| 2025 | $5,178 | $119,430 | $52,950 | $66,480 |
| 2024 | $5,178 | $82,740 | $36,400 | $46,340 |
| 2023 | $5,097 | $82,740 | $36,400 | $46,340 |
| 2022 | $6,322 | $95,870 | $36,400 | $59,470 |
| 2021 | $6,239 | $95,870 | $36,400 | $59,470 |
| 2020 | $4,536 | $66,900 | $30,320 | $36,580 |
| 2019 | $4,551 | $66,900 | $30,320 | $36,580 |
| 2018 | $4,187 | $54,330 | $24,230 | $30,100 |
| 2017 | $4,181 | $54,330 | $24,230 | $30,100 |
| 2016 | $3,618 | $47,330 | $20,750 | $26,580 |
| 2015 | $3,600 | $47,330 | $20,750 | $26,580 |
| 2014 | $3,725 | $47,920 | $13,660 | $34,260 |
Source: Public Records
Map
Nearby Homes
- 425 Gabriel Dr
- 456 Wilcox Ave
- 531 Goethe Ave
- 699 W Washington Ave
- 537 Goethe Ave
- 603 W Essex Ave
- 512 Bryan Ave
- 1312 W Essex Ave
- 1314 W Adams Ave
- 523 W Washington Ave
- 546 Dougherty Ferry Rd
- 706 N Geyer Rd
- 427 Central Place
- 444 W Washington Ave
- 450 W Adams Ave Unit 14
- 450 W Adams Ave Unit 18
- 841 N Geyer Rd
- 1001 Dovergate Dr
- 1612 Dougherty Ferry Rd
- 946 Rochdale Dr
- 716 Elmtree Ln
- 806 Elmtree Ln
- 749 Gabriel Ct
- 714 Elmtree Ln
- 737 Gabriel Ct
- 812 Elmtree Ln
- 803 Elmtree Ln
- 737 Elmtree Ln
- 712 Elmtree Ln
- 805 Elmtree Ln
- 757 Gabriel Ct
- 729 Gabriel Ct
- 729 Elmtree Ln
- 800 W Essex Ave
- 710 W Essex Ave
- 710 Elmtree Ln
- 818 Elmtree Ln
- 754 Gabriel Ct
- 821 Elmtree Ln
- 740 Gabriel Ct