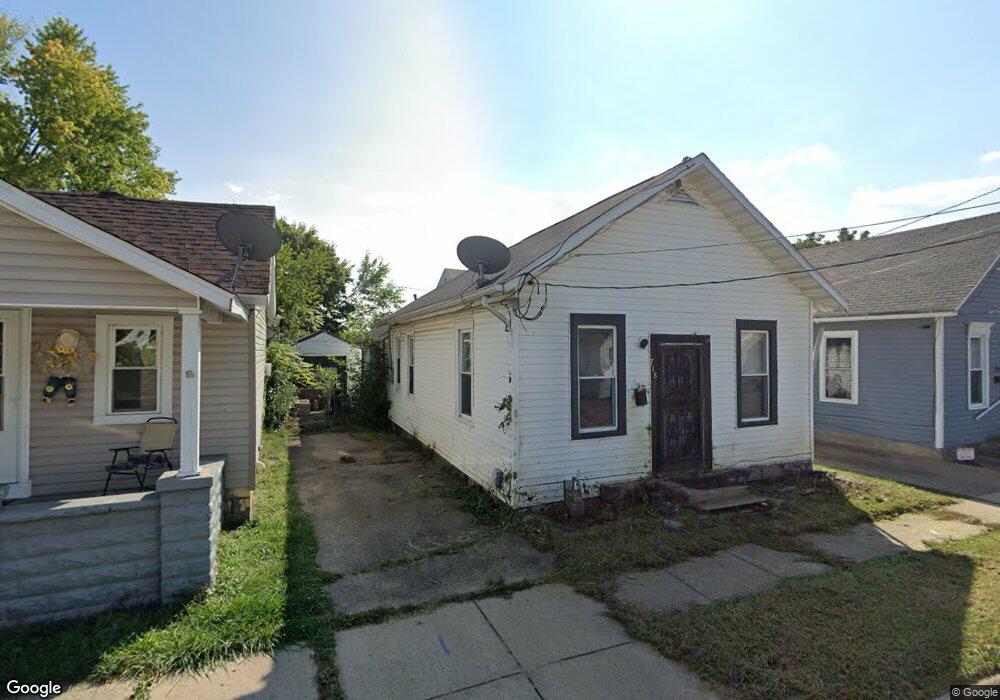
718 Fox St Sandusky, OH 44870
Estimated Value: $105,000 - $108,000
3
Beds
1
Bath
1,155
Sq Ft
$93/Sq Ft
Est. Value
About This Home
This home is located at 718 Fox St, Sandusky, OH 44870 and is currently estimated at $106,841, approximately $92 per square foot. 718 Fox St is a home located in Erie County with nearby schools including Sandusky High School, Monroe Preparatory Academy, and Sandusky Central Catholic School.
Ownership History
Date
Name
Owned For
Owner Type
Purchase Details
Closed on
Aug 7, 2017
Sold by
Harbour Protfolio Vii Lp
Bought by
Inverse Asset Fund Llc
Current Estimated Value
Purchase Details
Closed on
Feb 21, 2012
Sold by
Harbour Portfolio Vii Lp
Bought by
Johnson Maurice
Purchase Details
Closed on
Sep 23, 2011
Sold by
Fannie Mae
Bought by
Harbour Portfolio Vii Lp
Purchase Details
Closed on
May 26, 2011
Sold by
Jensen Amy and Jensen Eric M
Bought by
Federal National Mortgage Association
Purchase Details
Closed on
May 11, 1998
Sold by
Jensen Paul C
Bought by
Jensen Eric M and Jensen Amy S
Home Financials for this Owner
Home Financials are based on the most recent Mortgage that was taken out on this home.
Original Mortgage
$45,000
Interest Rate
7.2%
Mortgage Type
New Conventional
Create a Home Valuation Report for This Property
The Home Valuation Report is an in-depth analysis detailing your home's value as well as a comparison with similar homes in the area
Home Values in the Area
Average Home Value in this Area
Purchase History
| Date | Buyer | Sale Price | Title Company |
|---|---|---|---|
| Inverse Asset Fund Llc | $18,960 | None Available | |
| Johnson Maurice | $37,500 | None Available | |
| Harbour Portfolio Vii Lp | $8,483 | Attorney | |
| Federal National Mortgage Association | $70,235 | None Available | |
| Jensen Eric M | $60,000 | -- |
Source: Public Records
Mortgage History
| Date | Status | Borrower | Loan Amount |
|---|---|---|---|
| Previous Owner | Jensen Eric M | $45,000 |
Source: Public Records
Tax History
| Year | Tax Paid | Tax Assessment Tax Assessment Total Assessment is a certain percentage of the fair market value that is determined by local assessors to be the total taxable value of land and additions on the property. | Land | Improvement |
|---|---|---|---|---|
| 2025 | $1,143 | $21,010 | $2,338 | $18,672 |
| 2024 | $1,143 | $21,010 | $2,338 | $18,672 |
| 2023 | $1,420 | $17,380 | $1,872 | $15,508 |
| 2022 | $1,305 | $17,380 | $1,872 | $15,508 |
| 2021 | $889 | $17,380 | $1,870 | $15,510 |
| 2020 | $842 | $15,130 | $1,870 | $13,260 |
| 2019 | $866 | $15,130 | $1,870 | $13,260 |
| 2018 | $867 | $15,130 | $1,870 | $13,260 |
| 2017 | $894 | $15,560 | $2,010 | $13,550 |
| 2016 | $894 | $15,560 | $2,010 | $13,550 |
| 2015 | $810 | $15,560 | $2,010 | $13,550 |
| 2014 | $805 | $15,560 | $2,010 | $13,550 |
| 2013 | $398 | $15,560 | $2,010 | $13,550 |
Source: Public Records
Map
Nearby Homes
- 808 Fulton St
- 823 Decatur St
- 602 W Monroe St
- 17 Tyler Way
- 932 W Madison St
- 39 Zachary Dr S
- 528 Central Ave
- 1308 Vine St
- 1104 Hayes Ave
- 1204 W Monroe St
- 1203 W Monroe St
- 1016 Hayes Ave
- 1308 Stone St
- 911 A St
- 914 Hayes Ave
- 811 W Osborne St
- 1031 Columbus Ave
- 1035 Campbell St
- 1308 W Madison St
- 1505 Central Ave
Your Personal Tour Guide
Ask me questions while you tour the home.