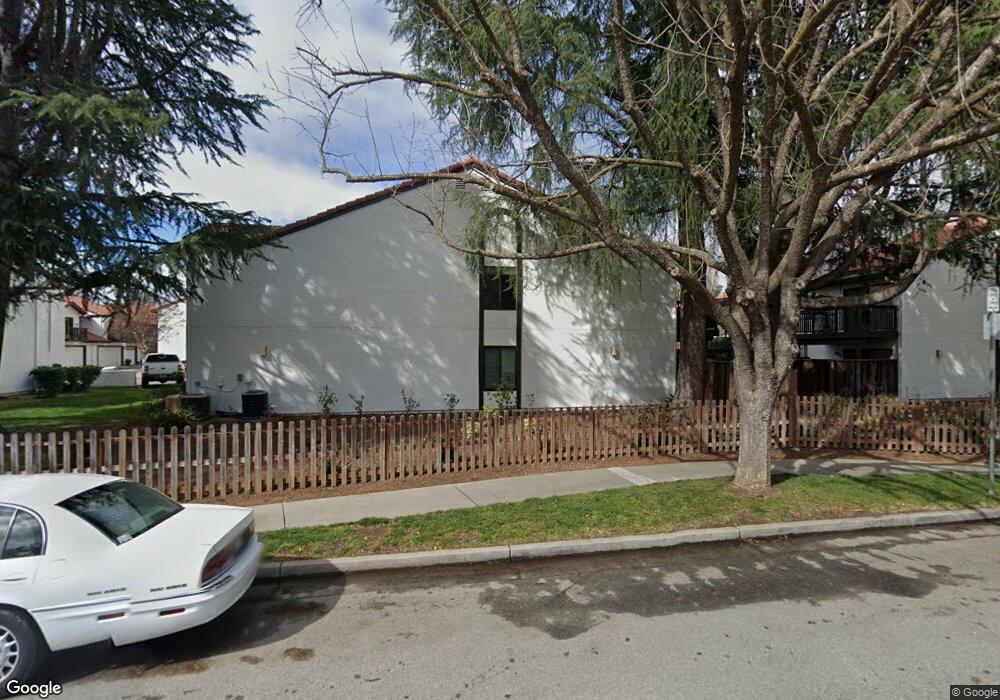
718 Gettysburg Way Unit C Gilroy, CA 95020
Estimated Value: $432,000 - $639,000
1
Bed
1
Bath
921
Sq Ft
$535/Sq Ft
Est. Value
About This Home
This home is located at 718 Gettysburg Way Unit C, Gilroy, CA 95020 and is currently estimated at $492,468, approximately $534 per square foot. 718 Gettysburg Way Unit C is a home located in Santa Clara County with nearby schools including Glen View Elementary School, Solorsano Middle School, and Gilroy High School.
Ownership History
Date
Name
Owned For
Owner Type
Purchase Details
Closed on
Jun 11, 2020
Sold by
Reimal M William
Bought by
M William Reimal And Benita L Reimal Family T and Reimal
Current Estimated Value
Purchase Details
Closed on
Oct 27, 2005
Sold by
Reimal M William and Reimal Benita L
Bought by
Reimal M William and Reimal Benita L
Purchase Details
Closed on
Jun 8, 1998
Sold by
Reimal M William and Reimal Benita L
Bought by
Reimal Teresa A
Home Financials for this Owner
Home Financials are based on the most recent Mortgage that was taken out on this home.
Original Mortgage
$94,400
Interest Rate
7.17%
Purchase Details
Closed on
Nov 5, 1996
Sold by
Tucker Curtiss
Bought by
Reimal Teresa A and William Reimal M
Home Financials for this Owner
Home Financials are based on the most recent Mortgage that was taken out on this home.
Original Mortgage
$90,000
Interest Rate
8.06%
Create a Home Valuation Report for This Property
The Home Valuation Report is an in-depth analysis detailing your home's value as well as a comparison with similar homes in the area
Home Values in the Area
Average Home Value in this Area
Purchase History
| Date | Buyer | Sale Price | Title Company |
|---|---|---|---|
| M William Reimal And Benita L Reimal Family T | -- | None Listed On Document | |
| Reimal M William | -- | None Available | |
| Reimal M William | -- | None Available | |
| Reimal M William | -- | None Available | |
| Reimal Teresa A | -- | Chicago Title Co | |
| Reimal Teresa A | $100,000 | Chicago Title Co |
Source: Public Records
Mortgage History
| Date | Status | Borrower | Loan Amount |
|---|---|---|---|
| Previous Owner | Reimal Teresa A | $94,400 | |
| Previous Owner | Reimal Teresa A | $90,000 |
Source: Public Records
Tax History
| Year | Tax Paid | Tax Assessment Tax Assessment Total Assessment is a certain percentage of the fair market value that is determined by local assessors to be the total taxable value of land and additions on the property. | Land | Improvement |
|---|---|---|---|---|
| 2025 | $2,048 | $162,839 | $48,844 | $113,995 |
| 2024 | $2,048 | $159,647 | $47,887 | $111,760 |
| 2023 | $2,036 | $156,518 | $46,949 | $109,569 |
| 2022 | $2,002 | $153,450 | $46,029 | $107,421 |
| 2021 | $1,993 | $150,442 | $45,127 | $105,315 |
| 2020 | $1,971 | $148,901 | $44,665 | $104,236 |
| 2019 | $1,954 | $145,983 | $43,790 | $102,193 |
| 2018 | $1,828 | $143,122 | $42,932 | $100,190 |
| 2017 | $1,864 | $140,317 | $42,091 | $98,226 |
| 2016 | $1,819 | $137,566 | $41,266 | $96,300 |
| 2015 | $1,718 | $135,501 | $40,647 | $94,854 |
| 2014 | $1,707 | $132,847 | $39,851 | $92,996 |
Source: Public Records
Map
Nearby Homes
- 750 W 9th St
- 500 W 10th St Unit 140
- 500 W 10th St Unit 177
- 7100 Potomac Place
- 6735 Stephan Ct
- 7305 Orchard Dr
- 7344 Ailes Ct
- 7310 Carmel St
- 7351 Princevalle St Unit Homesite 18
- 7360 Ailes Ct
- 7376 Ailes Ct
- 7384 Ailes Ct
- 7051 Eigleberry St
- 6535 Kings Place
- 700 Eschenburg Dr
- 7191 Eigleberry St
- 319 Churchill Place
- 45 Angra Way
- 7460 Miller Ave
- 6389 Tawhana Ln
- 718 Gettysburg Way Unit B
- 718 Gettysburg Way Unit A
- 718 Gettysburg Way Unit D
- 722 Gettysburg Way
- 714 Gettysburg Way Unit D
- 714 Gettysburg Way Unit C
- 714 Gettysburg Way Unit B
- 714 Gettysburg Way Unit A
- 724 Gettysburg Way
- 729 Gettysburg Way
- 725 Gettysburg Way
- 728 Gettysburg Way
- 723 Gettysburg Way
- 719 Gettysburg Way
- 733 Gettysburg Way
- 732 Gettysburg Way
- 715 Gettysburg Way
- 712 Gettysburg Way
- 735 Gettysburg Way
- 734 Gettysburg Way
Your Personal Tour Guide
Ask me questions while you tour the home.