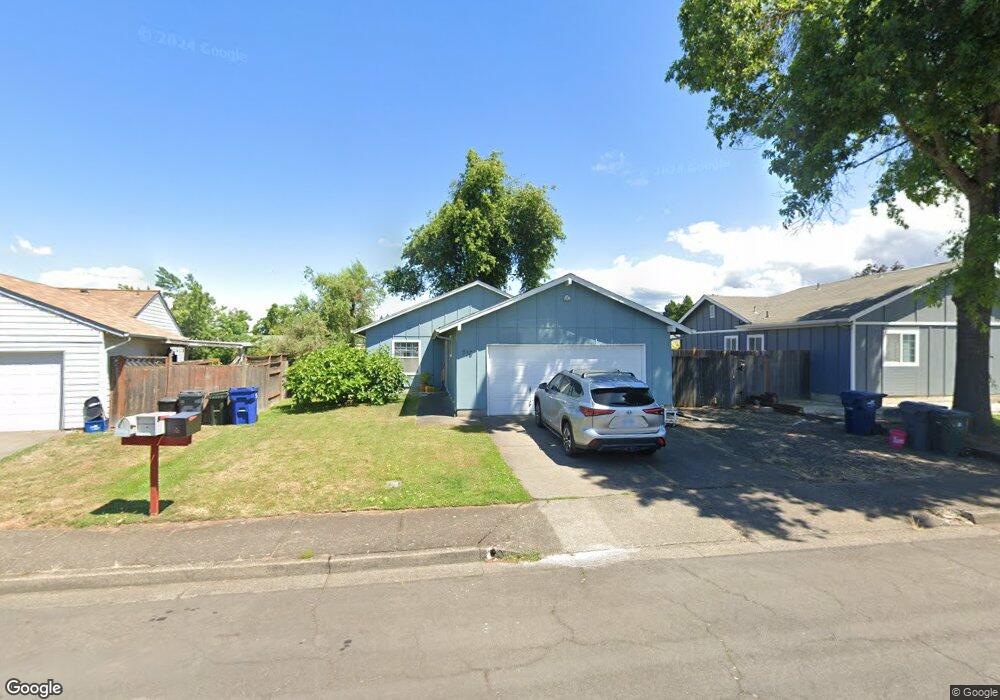
718 Island St Springfield, OR 97477
West Springfield NeighborhoodEstimated Value: $381,054 - $425,000
3
Beds
1
Bath
1,224
Sq Ft
$327/Sq Ft
Est. Value
About This Home
This home is located at 718 Island St, Springfield, OR 97477 and is currently estimated at $400,014, approximately $326 per square foot. 718 Island St is a home located in Lane County with nearby schools including Centennial Elementary School, Hamlin Middle School, and Springfield High School.
Ownership History
Date
Name
Owned For
Owner Type
Purchase Details
Closed on
May 23, 2013
Sold by
Reaksecker John Peter and Reaksecker Rebekah A
Bought by
Gwynn Kiley E and Gwyn Michael J
Current Estimated Value
Home Financials for this Owner
Home Financials are based on the most recent Mortgage that was taken out on this home.
Original Mortgage
$161,500
Outstanding Balance
$113,687
Interest Rate
3.41%
Mortgage Type
New Conventional
Estimated Equity
$286,327
Purchase Details
Closed on
Mar 13, 2002
Sold by
Slager Matthew F and Slager Jennifer C
Bought by
Reaksecker John Peter and Reaksecker Rebekah A
Home Financials for this Owner
Home Financials are based on the most recent Mortgage that was taken out on this home.
Original Mortgage
$120,277
Interest Rate
6.99%
Mortgage Type
FHA
Create a Home Valuation Report for This Property
The Home Valuation Report is an in-depth analysis detailing your home's value as well as a comparison with similar homes in the area
Home Values in the Area
Average Home Value in this Area
Purchase History
| Date | Buyer | Sale Price | Title Company |
|---|---|---|---|
| Gwynn Kiley E | $170,000 | First American Title | |
| Reaksecker John Peter | $122,000 | Western Pioneer Title Co |
Source: Public Records
Mortgage History
| Date | Status | Borrower | Loan Amount |
|---|---|---|---|
| Open | Gwynn Kiley E | $161,500 | |
| Previous Owner | Reaksecker John Peter | $120,277 |
Source: Public Records
Tax History
| Year | Tax Paid | Tax Assessment Tax Assessment Total Assessment is a certain percentage of the fair market value that is determined by local assessors to be the total taxable value of land and additions on the property. | Land | Improvement |
|---|---|---|---|---|
| 2025 | $2,624 | $143,108 | -- | -- |
| 2024 | $2,582 | $138,940 | -- | -- |
| 2023 | $2,582 | $134,894 | -- | -- |
| 2022 | $2,391 | $130,966 | $0 | $0 |
| 2021 | $2,348 | $127,152 | $0 | $0 |
| 2020 | $2,280 | $123,449 | $0 | $0 |
| 2019 | $2,211 | $119,854 | $0 | $0 |
| 2018 | $2,084 | $112,975 | $0 | $0 |
| 2017 | $2,004 | $112,975 | $0 | $0 |
| 2016 | $1,962 | $109,684 | $0 | $0 |
| 2015 | $1,906 | $106,489 | $0 | $0 |
| 2014 | $1,877 | $103,387 | $0 | $0 |
Source: Public Records
Map
Nearby Homes
- 930 Prescott Ln
- 992 Sunset Dr
- 1074 Hamilton St
- 952 Summit Blvd
- 0 Summit Blvd Unit 101337462
- 428 W Centennial Blvd
- 804 W N St
- 552 W D St
- 1424 Wimbledon Place
- 1533 Sequoia Ave
- 1566 Laura St
- 1505 Canal St
- 835 Anderson Ln
- 1233 1st St
- 207 W D St
- 1310 W Quinalt St
- 1130 Anderson Ln
- 1450 W Quinalt St
- 239 D St
- 364 Scotts Glen Dr
Your Personal Tour Guide
Ask me questions while you tour the home.