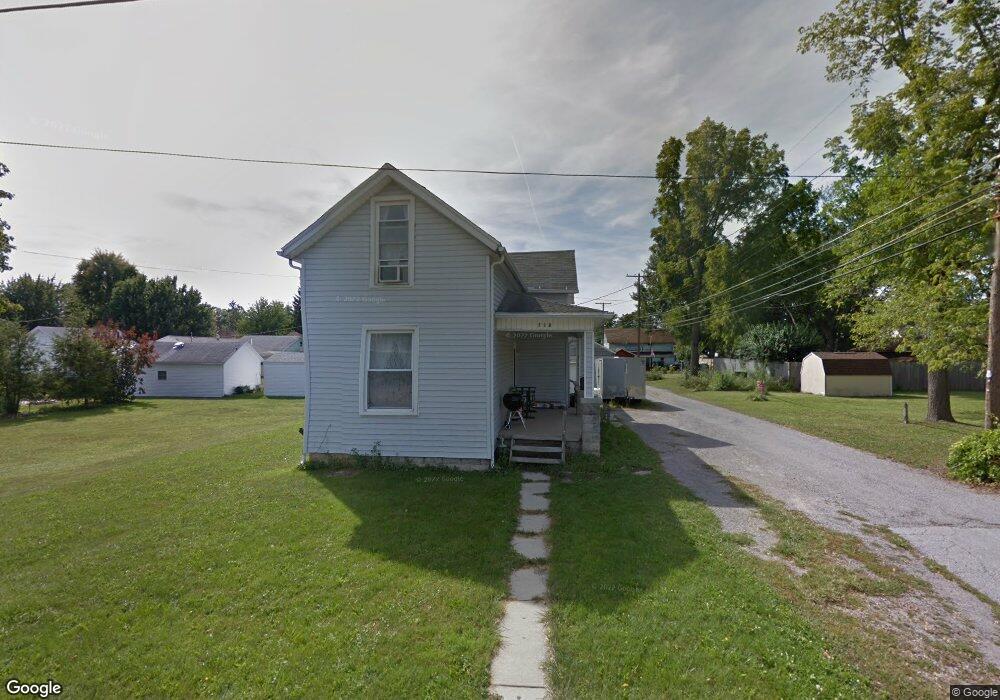
718 Morse St Findlay, OH 45840
Estimated Value: $121,000 - $164,761
4
Beds
2
Baths
1,322
Sq Ft
$110/Sq Ft
Est. Value
About This Home
This home is located at 718 Morse St, Findlay, OH 45840 and is currently estimated at $145,190, approximately $109 per square foot. 718 Morse St is a home located in Hancock County with nearby schools including Whittier Elementary School, Wilson Vance Elementary School, and Donnell Middle School.
Ownership History
Date
Name
Owned For
Owner Type
Purchase Details
Closed on
Jul 11, 2001
Sold by
Nesler Danny D
Bought by
Swanger Scott A and Swanger Karen L
Current Estimated Value
Purchase Details
Closed on
Feb 25, 1981
Bought by
Nesler Danny D and Nesler Scharlene
Create a Home Valuation Report for This Property
The Home Valuation Report is an in-depth analysis detailing your home's value as well as a comparison with similar homes in the area
Home Values in the Area
Average Home Value in this Area
Purchase History
| Date | Buyer | Sale Price | Title Company |
|---|---|---|---|
| Swanger Scott A | $64,000 | -- | |
| Nesler Danny D | -- | -- |
Source: Public Records
Mortgage History
| Date | Status | Borrower | Loan Amount |
|---|---|---|---|
| Closed | Swanger Scott A | -- |
Source: Public Records
Tax History Compared to Growth
Tax History
| Year | Tax Paid | Tax Assessment Tax Assessment Total Assessment is a certain percentage of the fair market value that is determined by local assessors to be the total taxable value of land and additions on the property. | Land | Improvement |
|---|---|---|---|---|
| 2024 | $1,508 | $42,440 | $4,620 | $37,820 |
| 2023 | $1,510 | $42,440 | $4,620 | $37,820 |
| 2022 | $1,505 | $42,440 | $4,620 | $37,820 |
| 2021 | $1,112 | $27,320 | $4,620 | $22,700 |
| 2020 | $1,112 | $27,320 | $4,620 | $22,700 |
| 2019 | $1,089 | $27,320 | $4,620 | $22,700 |
| 2018 | $951 | $21,830 | $4,200 | $17,630 |
| 2017 | $949 | $21,830 | $4,200 | $17,630 |
| 2016 | $946 | $21,830 | $4,200 | $17,630 |
| 2015 | $980 | $22,420 | $4,200 | $18,220 |
| 2014 | $980 | $22,420 | $4,200 | $18,220 |
| 2012 | $975 | $22,070 | $4,200 | $17,870 |
Source: Public Records
Map
Nearby Homes
- 820 Selby St
- 904 Morse St
- 15591 Canadian Way
- 15586 Canadian Way
- 15615 Canadian Way
- 817 Park St
- 420 1st St
- 210 Eastowne Park Row
- 1109 Brookside Dr
- 829 Maple Ave
- 1001 Decker Ave
- 619 Fishlock Ave
- 1109 Park St
- 202 Hancock St
- 1037 Fishlock Ave
- 545 Clinton Ct
- 309 Huron Rd
- 523 Center St
- 1301 Fishlock Ave
- 1802 Lippincott Ave
- 634 Wyandot St
- 630 Wyandot St
- 638 Wyandot St
- 628 Wyandot St
- 635 E Lincoln St
- 637 E Lincoln St
- 633 E Lincoln St
- 622 Wyandot St
- 627 E Lincoln St
- 719 Morse St
- 619 1/2 E Lincoln St
- 721 Morse St
- 715 Morse St
- 619 E Lincoln St
- 723 Morse St
- 618 Wyandot St
- 713 Morse St
- 623 E Lincoln St
- 700 Wyandot St
- 707 Morse St