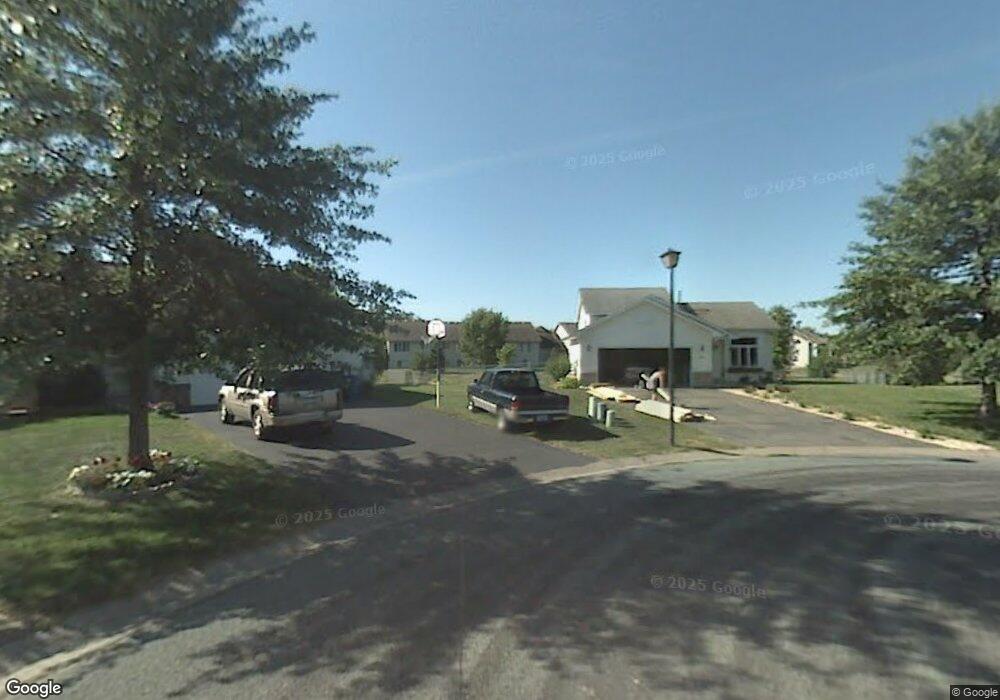
7184 Cinnamon Teal Ct Circle Pines, MN 55014
Estimated Value: $362,143 - $410,000
3
Beds
2
Baths
926
Sq Ft
$414/Sq Ft
Est. Value
About This Home
This home is located at 7184 Cinnamon Teal Ct, Circle Pines, MN 55014 and is currently estimated at $383,036, approximately $413 per square foot. 7184 Cinnamon Teal Ct is a home located in Anoka County with nearby schools including Blue Heron Elementary School, Centennial Middle School, and Centennial High School.
Ownership History
Date
Name
Owned For
Owner Type
Purchase Details
Closed on
May 12, 2016
Sold by
Backus Matthew R and Backus Cynthia K
Bought by
George Jason and George Elizabeth
Current Estimated Value
Home Financials for this Owner
Home Financials are based on the most recent Mortgage that was taken out on this home.
Original Mortgage
$225,050
Outstanding Balance
$173,658
Interest Rate
2.75%
Mortgage Type
Adjustable Rate Mortgage/ARM
Estimated Equity
$209,378
Purchase Details
Closed on
Jun 15, 2006
Sold by
Linner Jeffrey A and Linner Amy
Bought by
Backus Matthew R and Backus Cynthia K
Home Financials for this Owner
Home Financials are based on the most recent Mortgage that was taken out on this home.
Original Mortgage
$191,200
Interest Rate
6.73%
Mortgage Type
New Conventional
Purchase Details
Closed on
Apr 28, 2000
Sold by
Radeck David J and Radeck Gina M
Bought by
Linner Jeffrey A
Create a Home Valuation Report for This Property
The Home Valuation Report is an in-depth analysis detailing your home's value as well as a comparison with similar homes in the area
Home Values in the Area
Average Home Value in this Area
Purchase History
| Date | Buyer | Sale Price | Title Company |
|---|---|---|---|
| George Jason | $236,900 | Burnet Title | |
| Backus Matthew R | $239,000 | -- | |
| Linner Jeffrey A | $154,500 | -- |
Source: Public Records
Mortgage History
| Date | Status | Borrower | Loan Amount |
|---|---|---|---|
| Open | George Jason | $225,050 | |
| Previous Owner | Backus Matthew R | $191,200 |
Source: Public Records
Tax History Compared to Growth
Tax History
| Year | Tax Paid | Tax Assessment Tax Assessment Total Assessment is a certain percentage of the fair market value that is determined by local assessors to be the total taxable value of land and additions on the property. | Land | Improvement |
|---|---|---|---|---|
| 2025 | $3,746 | $332,600 | $123,000 | $209,600 |
| 2024 | $3,746 | $325,900 | $116,600 | $209,300 |
| 2023 | $3,578 | $330,400 | $116,600 | $213,800 |
| 2022 | $3,227 | $328,500 | $105,100 | $223,400 |
| 2021 | $3,202 | $259,900 | $80,000 | $179,900 |
| 2020 | $3,378 | $251,800 | $80,000 | $171,800 |
| 2019 | $3,302 | $255,100 | $79,800 | $175,300 |
| 2018 | $2,932 | $237,500 | $0 | $0 |
| 2017 | $2,570 | $231,700 | $0 | $0 |
| 2016 | $2,683 | $198,100 | $0 | $0 |
| 2015 | -- | $198,100 | $71,300 | $126,800 |
| 2014 | -- | $176,000 | $66,000 | $110,000 |
Source: Public Records
Map
Nearby Homes
- 7147 Ivy Ridge Ct
- 506 Aqua Cir
- 7095 Ivy Ridge Ln
- 7298 Lea Ct N Unit 6
- 7009 Sunrise Dr
- 7164 Sunset Ave
- 6924 Lakeview Dr
- 695 Eagle Ct
- 4743 104th Ave NE
- 4660 104th Ln NE
- 227 Palomino Ln
- 10622 Marmon St NE
- 114 South Dr Unit D
- 105 South Dr Unit D
- 7797 Marilyn Dr
- 137 Century Trail
- 197 Century Trail
- 104 South Dr
- 140 Stallion Ln
- 100 South Dr Unit E
- 7188 Cinnamon Teal Ct
- 7181 Cinnamon Teal Ct
- 7175 Ivy Ridge Ct
- 7173 Ivy Ridge Ct
- 7192 Cinnamon Teal Ct
- 7177 Ivy Ridge Ct
- 7171 Ivy Ridge Ct
- 7187 Cinnamon Teal Ct
- 7179 Ivy Ridge Ct
- 7169 Ivy Ridge Ct
- 7195 Cinnamon Teal Ct
- 7196 Cinnamon Teal Ct
- 7167 Ivy Ridge Ct
- 7184 Gray Heron Dr
- 7165 Ivy Ridge Ct
- 7199 Cinnamon Teal Ct
- 7178 Gray Heron Dr
- 7200 Cinnamon Teal Ct
- 7190 Gray Heron Dr
- 7163 Ivy Ridge Ct