N
Seller's Agent in 2025
Non-IRES Agent
CO_IRES
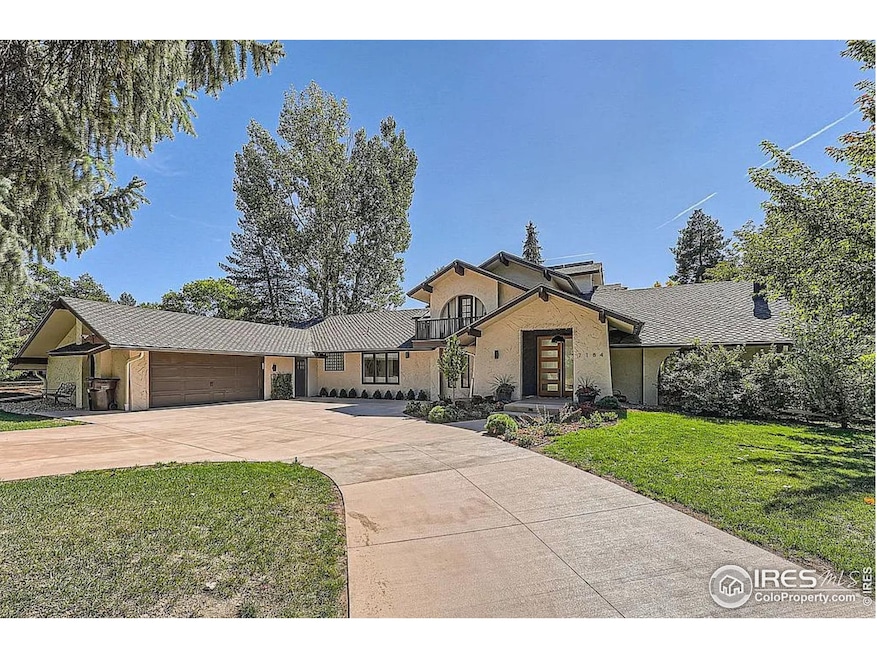

Estimated Value: $2,242,000 - $2,788,000
Entered for comparable use purpose.
Last Agent to Sell the Property
Non-IRES Agent
Non-IRES Listed on: 09/30/2024
| Date | Buyer | Sale Price | Title Company |
|---|---|---|---|
| Rider Jones Teresa | $2,750,000 | First American Title | |
| Vandepoll Susan D | -- | None Available | |
| Vande Poll Susan D | $835,000 | Fidelity National Title Ins | |
| Lentz Eduardo Alejandro | $359,000 | Commonwealth Land Title | |
| Vande Poll Susan D | $294,300 | -- | |
| Vande Poll Susan D | $126,500 | -- | |
| Vande Poll Susan D | $15,000 | -- |
| Date | Status | Borrower | Loan Amount |
|---|---|---|---|
| Open | Rider Jones Teresa | $750,000 | |
| Previous Owner | Vandepoll Susan D | $605,550 | |
| Previous Owner | Vande Poll Susan D | $668,000 | |
| Previous Owner | Lentz Eduardo Alejandro | $287,200 |
| Date | Event | Price | List to Sale | Price per Sq Ft | Prior Sale |
|---|---|---|---|---|---|
| 02/14/2025 02/14/25 | Sold | $2,750,000 | -4.5% | $677 / Sq Ft | |
| 01/15/2025 01/15/25 | Pending | -- | -- | -- | |
| 09/30/2024 09/30/24 | For Sale | $2,880,000 | +244.9% | $709 / Sq Ft | |
| 01/28/2019 01/28/19 | Off Market | $835,000 | -- | -- | |
| 04/12/2016 04/12/16 | Sold | $835,000 | +0.7% | $207 / Sq Ft | View Prior Sale |
| 03/13/2016 03/13/16 | Pending | -- | -- | -- | |
| 01/29/2016 01/29/16 | For Sale | $829,000 | -- | $206 / Sq Ft |
| Year | Tax Paid | Tax Assessment Tax Assessment Total Assessment is a certain percentage of the fair market value that is determined by local assessors to be the total taxable value of land and additions on the property. | Land | Improvement |
|---|---|---|---|---|
| 2025 | $8,604 | $91,307 | $42,088 | $49,219 |
| 2024 | $8,462 | $93,184 | $41,916 | $51,268 |
| 2023 | $8,462 | $93,184 | $45,600 | $51,268 |
| 2022 | $7,062 | $72,489 | $33,951 | $38,538 |
| 2021 | $6,733 | $74,575 | $34,928 | $39,647 |
| 2020 | $5,782 | $63,306 | $30,602 | $32,704 |
| 2019 | $5,695 | $63,306 | $30,602 | $32,704 |
| 2018 | $5,890 | $64,771 | $25,488 | $39,283 |
| 2017 | $5,714 | $71,608 | $28,178 | $43,430 |
| 2016 | $5,090 | $56,007 | $23,482 | $32,525 |
| 2015 | $4,833 | $51,239 | $26,666 | $24,573 |
| 2014 | $4,685 | $51,239 | $26,666 | $24,573 |
N
Seller's Agent in 2025
Non-IRES Agent
CO_IRES

Buyer's Agent in 2025
Nissa Hall
eXp Realty LLC
(720) 425-4870
4 in this area
42 Total Sales
Seller's Agent in 2016
Patrick Dolan
RE/MAX
(303) 441-5642
95 in this area
331 Total Sales
Seller Co-Listing Agent in 2016
Kelly Atteridg
RE/MAX
(303) 817-0138
76 in this area
209 Total Sales
Source: IRES MLS
MLS Number: IRE1029688
APN: 1463123-12-004
Disclaimer: Certain information contained herein is derived from information provided by parties other than Homes.com. All information provided is deemed reliable, but is not guaranteed to be accurate and should be independently verified.
![]() Information source: Information and Real Estate Services, LLC. Provided for limited non-commercial use only under IRES Rules © Copyright IRES.
Information source: Information and Real Estate Services, LLC. Provided for limited non-commercial use only under IRES Rules © Copyright IRES.
Based on information submitted to the MLS GRID. All data is obtained from various sources and may not have been verified by broker or MLS GRID. Supplied Open House Information is subject to change without notice. All information should be independently reviewed and verified for accuracy. Properties may or may not be listed by the office/agent presenting the information. Some IDX listings have been excluded from this website. Listing information is provided exclusively for consumers' personal, non-commercial use and may not be used for any purpose other than to identify prospective properties consumers may be interested in purchasing.
Information deemed reliable but not guaranteed by the MLS.
Based on information submitted to the MLS GRID
Ask me questions while you tour the home.